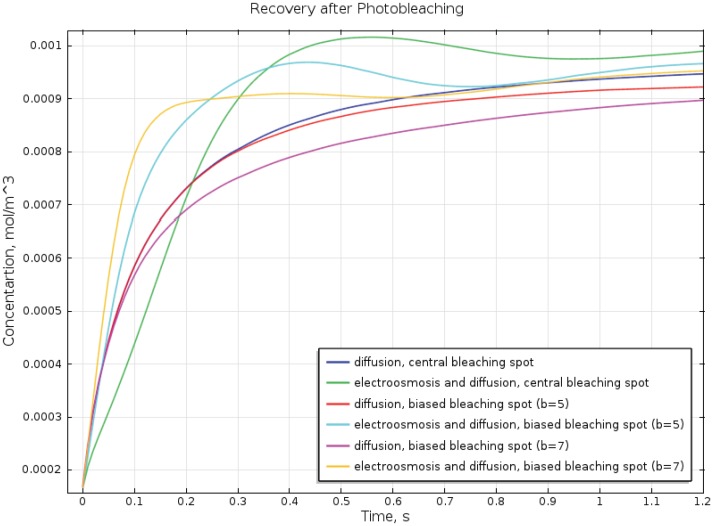
Figure 6. Dynamics of the recovery of the fluorescence after photobleaching.
Concentration of the fluorescently labeled protein averaged over the small cylinder near the top of the cell presented in Fig. 5. Blue, red, and magenta curves represent recovery of the fluorescence due to pure diffusion for central (blue), biased b = 5 µm (red), and biased b = 7 µm (magenta) locations of the bleaching spot. In case of pure diffusion the time of 50% recovery does not depend on the position of the bleaching spot. On the contrary, in case of electroosmosis and diffusion, the recovery curves differ substantially for the different locations of the bleach spot: central-green, b = 5 µm -cyan, b = 7 µm-yellow. The 50% recovery time differs for these locations: 0.12 s, 0.058 s, and 0.04 s. Therefore diffusion coefficients determined from these values of recovery time might differ 3-fold as well. See text for more detailed discussion.

