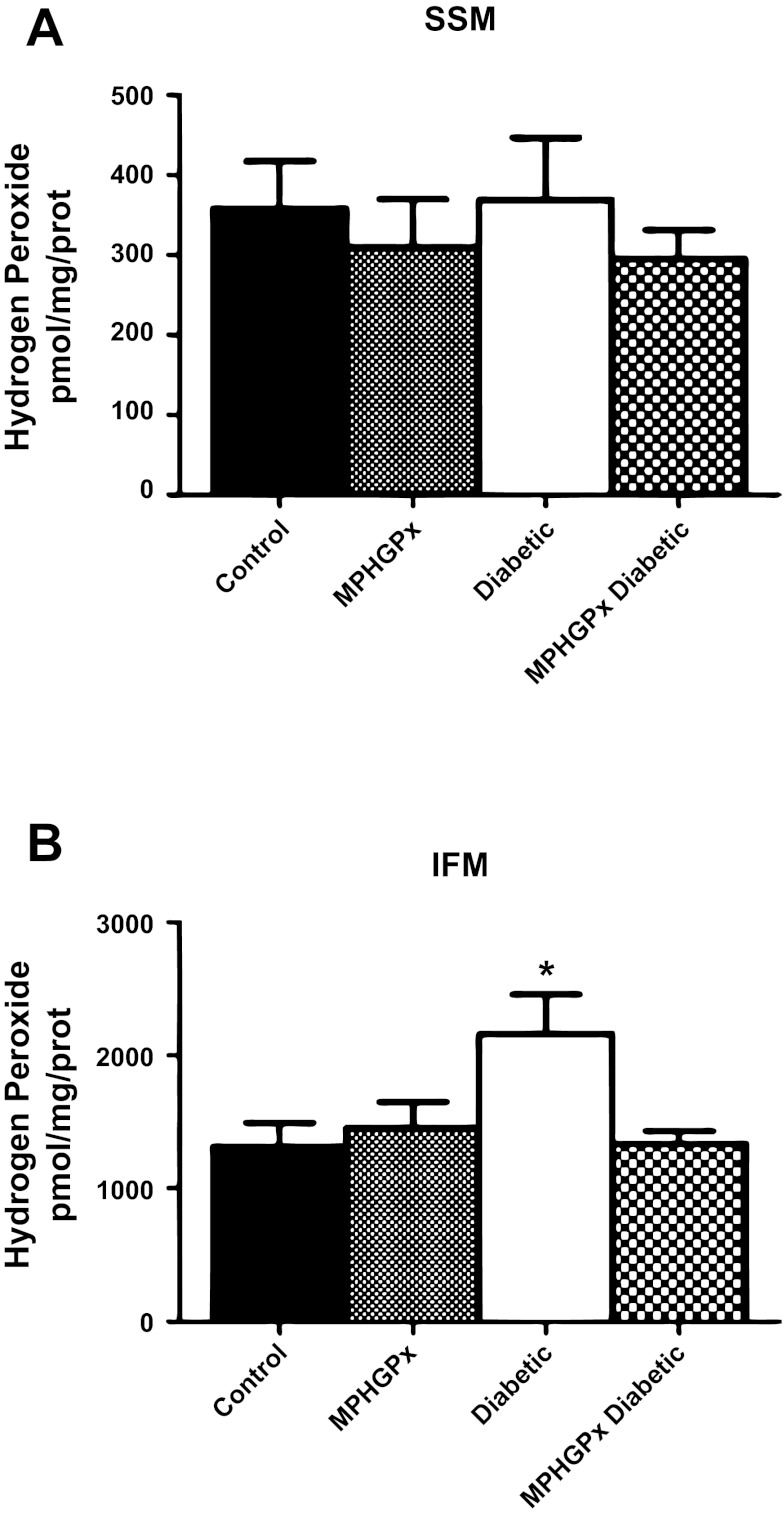
Fig. 3.
H2O2 production. H2O2 production in SSM (A) and IFM (B) was determined using the oxidation of the fluorogenic indicator amplex red in the presence of horseradish peroxidase. H2O2 production was initiated in mitochondria using glutamate-malate as substrates. Standard curves were obtained by adding known amounts of H2O2 to the assay medium in the presence of the substrates amplex red and horseradish peroxidase. Final values were calculated as pmol/mg of protein. Values are expressed as means ± SE. *P < 0.05 for diabetic vs. all groups.

