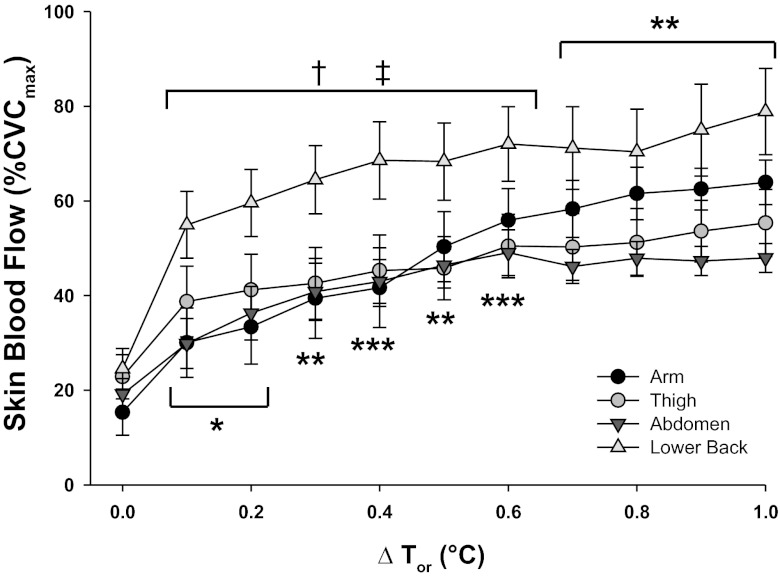
Fig. 3.
Regional skin blood flow (%CVCmax) during whole body heating to 1°C rise in Tor at ventral forearm (A), thigh (B), abdomen (C), and lower back (D). Values significantly different from thigh, *P < 0.05, **P < 0.01, ***P < 0.001; significantly different from abdomen site, †P < 0.05, ††P < 0.01; significantly different from arm, ‡P < 0.05, following Bonferroni correction to adjust for multiple comparisons.

