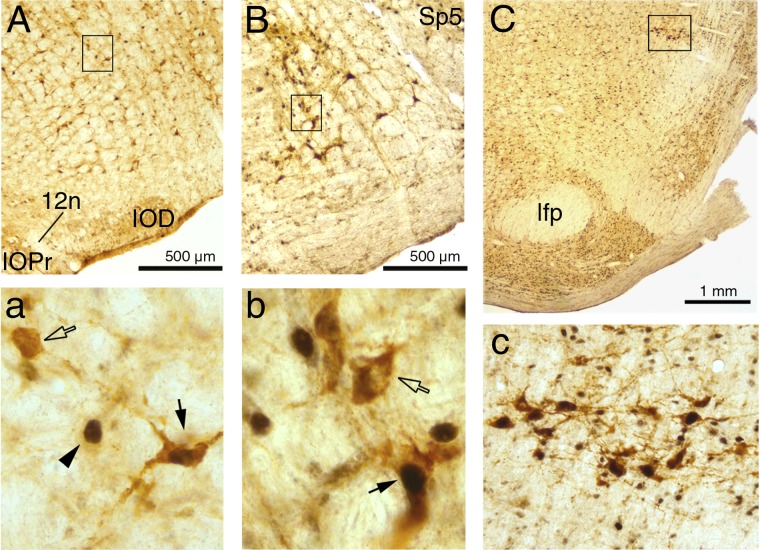
Fig. 2.
Examples of dopamine β-hydroxylase (DBH)-positive cells with or without c-Fos-stained nuclei in the A1/C1 (A), A5 (B), and A7 (C) groups. In each column, the top shows a low-magnification image and the bottom shows an enlarged image of the detail framed in the top. The filled and open arrows in the high magnification images for the A1/C1 (a) and A5 (b) groups point to examples of DBH-positive cells with and without c-Fos-stained nuclei, respectively, and the arrowhead in a points to a c-Fos-labeled nucleus in a cell of an unidentified phenotype. The images of the A7 group (C and c) are shown at a lower magnification than in the other panels to visualize the location of the entire A7 group (C) and all its cells in this brain section (c). According to a rat brain atlas (44), the anteroposterior levels closest to these three examples are the following: −13.20 mm (A), −10.56 mm (B), and −8.52 mm (C) relative to bregma. 12n, roots of the hypoglossal nerve; IOD, inferior olive, dorsal division; IOPr, inferior olive, principal division; lfp, longitudinal fasciculus of the pons; Sp5, spinal trigeminal sensory nucleus.

