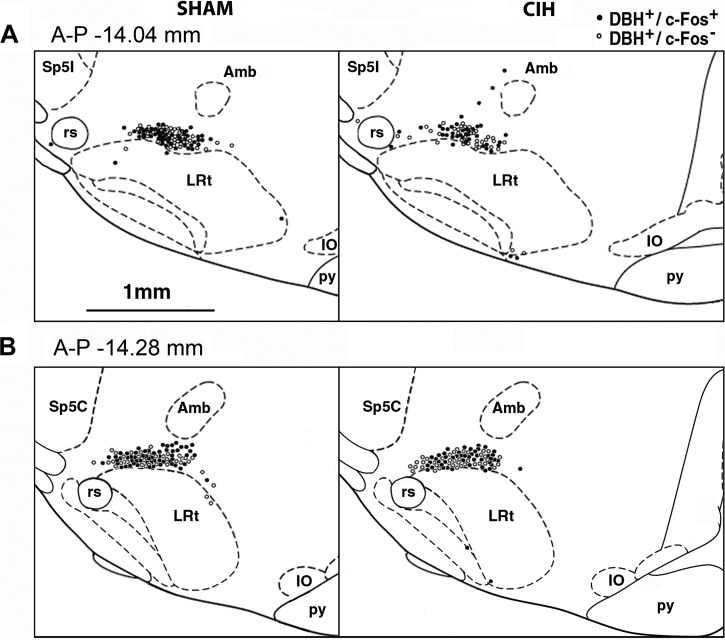
Fig. 3.
Distribution of c-Fos-positive (c-Fos+) and c-Fos-negative (c-Fos−) DBH cells at two anteroposterior (A-P) levels corresponding to the medullary noradrenergic A1 group. Locations of all DBH cells found on one side at these two levels in all 6 sham-treated and 6 CIH-exposed rats were redrawn onto the corresponding standard cross-sections from a rat brain atlas (44). At both levels, the percentage of DBH cells that were c-Fos+ (filled circles) was higher in sham-treated than in CIH-exposed rats, with values similar to the average data for the entire A1 group (58.5% sham vs. 51.9% CIH at A-P −14.04 mm from bregma, and 59.4% sham vs. 55.2% CIH at A-P −14.28 mm from bregma; see Table 1 for the corresponding data for the entire A1 group). There was no obvious aggregation of c-Fos+ or c-Fos− (open circles) DBH cells within the A1 region either within or between the treatment groups. Amb, nucleus ambiguus; IO, inferior olive; LRt, lateral reticular nucleus; py, pyramidal tract; rs, rubrospinal tract; Sp5C, spinal trigeminal sensory nucleus, caudal division; Sp5I, spinal trigeminal sensory nucleus, interpolar division.

