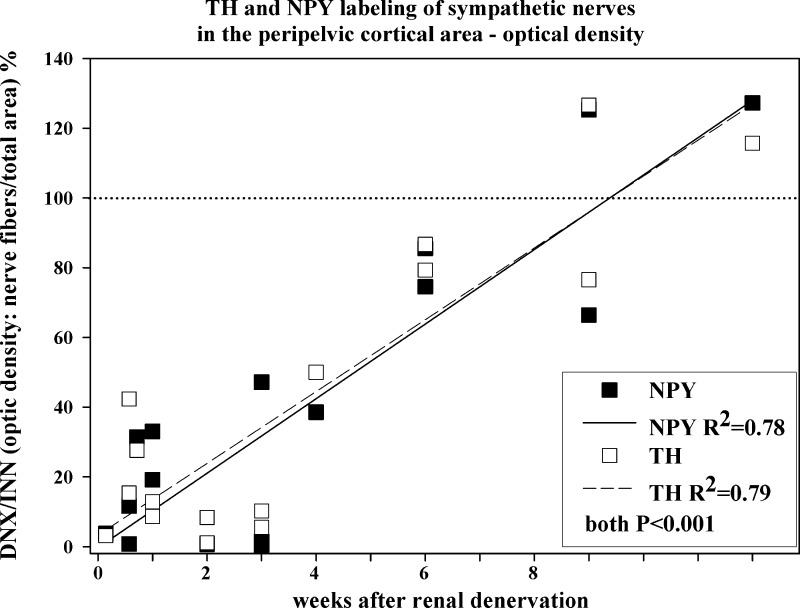
Fig. 3.
The ratio between the denervated and innervated kidney in each rat of the optical density of NPY/tyrosine hydroxylase (TH)-ir fibers in the renal pelvic wall at various time points following unilateral renal denervation. Closed and open symbols, denervated-to-innervated ratio of the optical density of NPY-ir and TH-ir fibers, respectively; solid and dashed lines, linear regression of the denervated-to-innervated ratio of the optical density of NPY-ir and TH-ir fibers, respectively, vs. time; n = 17.

