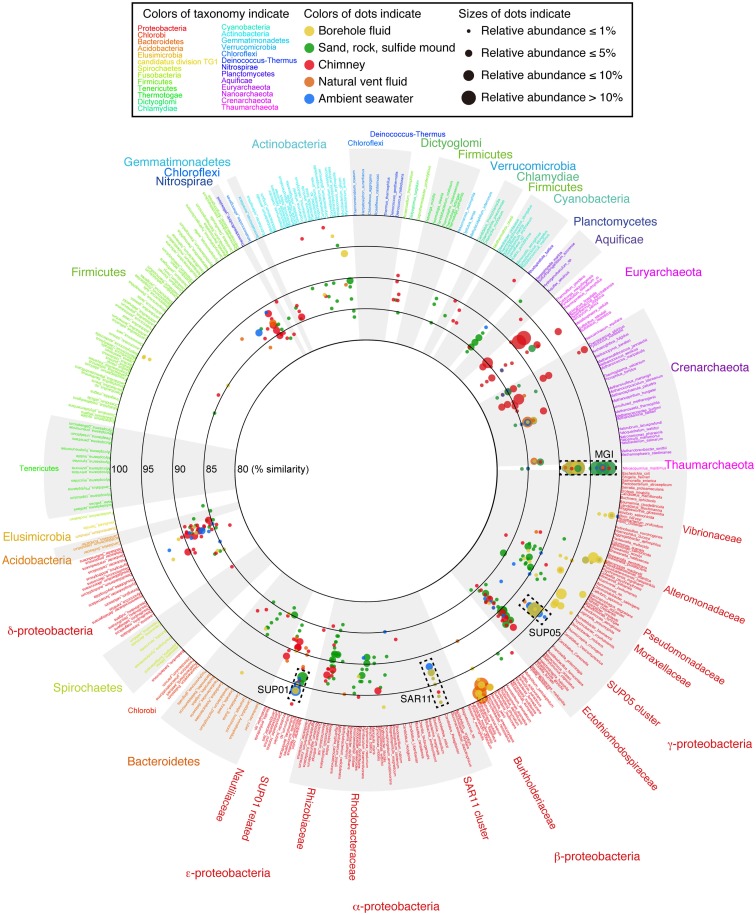
Figure 3.
The overview of the microbial community structures for the whole prokaryote based on 16S rRNA gene sequences visualized by VITCOMIC. Scientific names of prokaryotic species in the reference database of VITCOMIC are shown outside of the circle. The font color for each name indicates its phylum name as shown in the box and outside of the circle. The large circles indicate boundaries of similarities (80, 85, 90, 95, and 100% similarities to the database sequence). The location of colored dots represents average similarity of full-length sequence of amplicon of each phylotype against the nearest relative species. The color of the dots indicates the sample type as shown in the box. The VITCOMIC analysis for archaeal or bacterial communities was performed separately. The total number of archaeal or bacterial sequences in the all samples is 1,011 or 1,025, respectively. The size of the dots indicates relative abundance of the phylotypes in the archaeal or bacterial clone library integrated by the sample type (smallest dot < 1%, second smallest dot < 5%, third smallest dot < 10%, and the largest dot > 10%).

