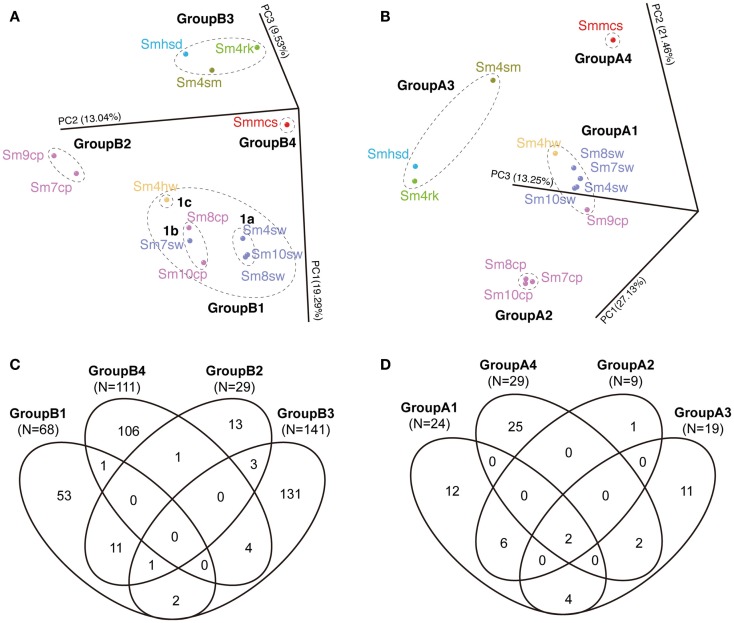
Figure 5.
Comparison of bacterial and archaeal community structures of the Suiyo Seamount. The results of (A,B) PCoA and (C,D) Venn diagrams indicating the shared phylotype numbers among the groups defined in the PCoA are shown. The results of the comparative analyses for (A,C) bacterial and (B,D) archaeal communities are shown. (A,B) The percentages in the axis labels represent the percentages of variation explained by the principal coordinates. (A,B) The color of the sample name indicates each sample type: purple, borehole fluid; orange, natural vent fluid; ultramarine, seawater; green, rock; sky blue, sand; olive, sulfide mound; red, active chimney.

