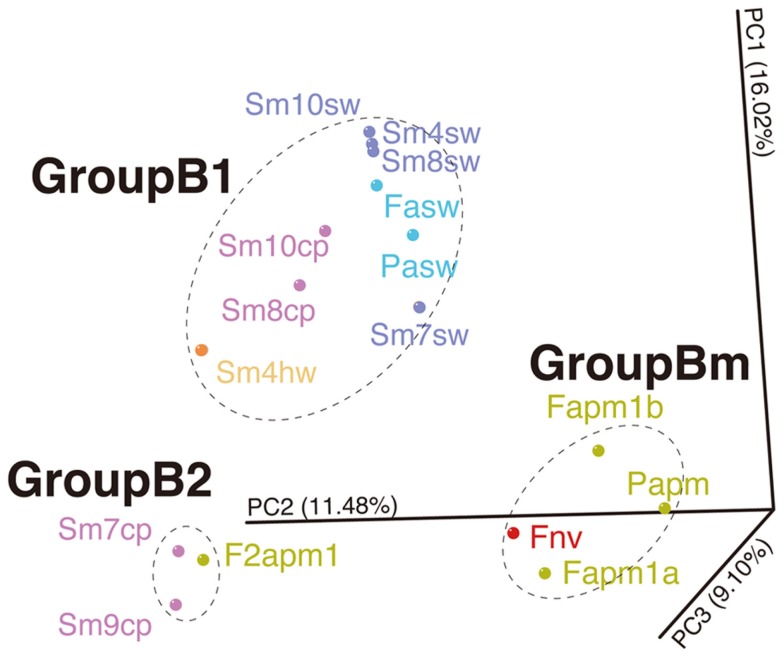
Figure 6.
Comparison of bacterial communities between the Suiyo Seamount and Southern Mariana Trough. The results of PCoA are shown. Data from the previous reports of the Southern Mariana Trough (Kato et al., 2009c) are included in this analysis: Fapm1a, Fapm1b, Papm, F2apm1, Fnv, Fasw, and Pasw. The percentages in the axis labels represent the percentages of variation explained by the principal coordinates.

