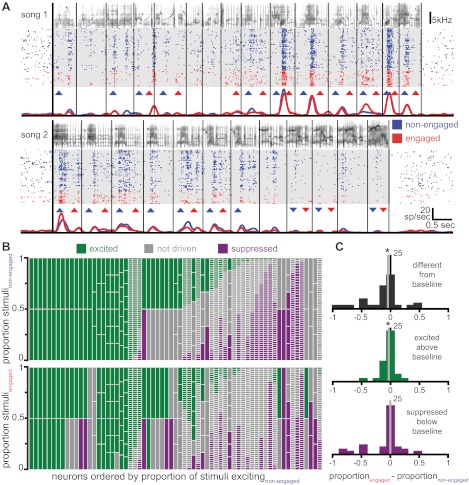
Fig. 3.
Neurons are driven by fewer acoustic stimuli when birds are engaged in an auditory recognition task. A: responses of a neuron to 2 different example stimuli. For each stimulus there is depicted the spectrogram of the song (top), raster plots of the occurrence of action potentials on each trial (middle; each row is a trial and each colored dot represents the occurrence of an action potential; song 1: 56 trials, song 2: 52 trials), and the time-varying firing rate for trials in each condition (bottom). Vertical black lines depict motif boundaries in the stimulus, and upward- and downward-pointing triangles denote motifs for which the firing rate was significantly higher or lower than baseline levels, respectively, in either of the 2 conditions (nonengaged and engaged). B: each vertical column depicts the stimuli presented to a neuron, with colors representing the proportion of these stimuli that were excited above baseline levels (green), suppressed below baseline levels (purple), or not significantly different from baseline levels (gray), in both the nonengaged (top) and engaged (bottom) conditions. Horizontal white lines in each column separate individual stimuli. The neurons are sorted by 1) the proportion of stimuli exciting the neuron during the nonengaged condition, 2) the proportion of stimuli suppressing the neuron during the nonengaged condition, and 3) the number of stimuli presented to each neuron. C: each of the 3 histograms represents the frequency of observing a given difference between the engaged and nonengaged conditions in the proportion of stimuli that were significantly different from spontaneous values (top), excited above baseline (middle), and suppressed below baseline (bottom). Values on left indicate that there was a higher proportion of stimuli in the nonengaged condition, and values on right indicate that there was a higher proportion in the engaged condition. The top 2 distributions have medians that are significantly different from zero (*).

