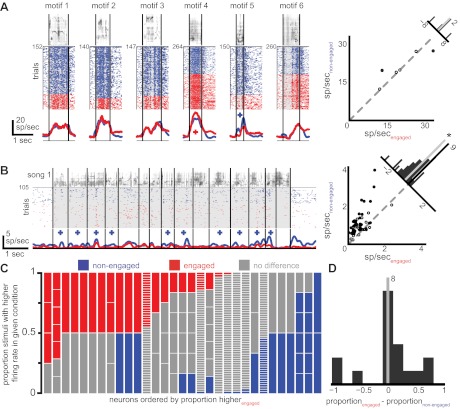
Fig. 4.
Neurons respond differently when birds are engaged in an auditory recognition task than when the birds are not task engaged. A, left: responses of an example neuron to training stimuli as in Fig. 3A, except that instead of triangles plus signs now denote motifs for which the firing rate is significantly different between the conditions (blue plus sign, nonengaged higher; red plus sign, engaged higher). All 6 motifs that made up the bird's training set are depicted. Right: circles represent the firing rate of all stimuli presented to this neuron in both the nonengaged (y-axis) and engaged (x-axis) conditions. Filled circles denote individual stimuli that are significantly different between the 2 conditions. The histogram at top right displays the distribution of the difference in firing rate between the engaged and nonengaged conditions for all stimuli (gray line, median). B: a different example neuron from a bird trained with long songs shows an overall decrease in firing rate during the engaged condition compared with the nonengaged condition. The median (gray line) of firing rate differences depicted in the histogram is significantly below zero (*). C: similar to Fig. 3B, for neurons that show any significant differences between the engaged and nonengaged conditions each vertical column depicts the stimuli presented to a neuron, with colors representing the proportion of these stimuli that elicited significantly different firing rates between the 2 conditions (red, engaged higher; blue, nonengaged higher; gray, not significantly different). Neurons are sorted by the proportion of stimuli eliciting a higher firing rate during the engaged condition. D: for stimuli that show differences in firing rate in the 2 conditions, these differences are equally distributed between increases and decreases with task engagement (the distribution is not shifted from zero).

