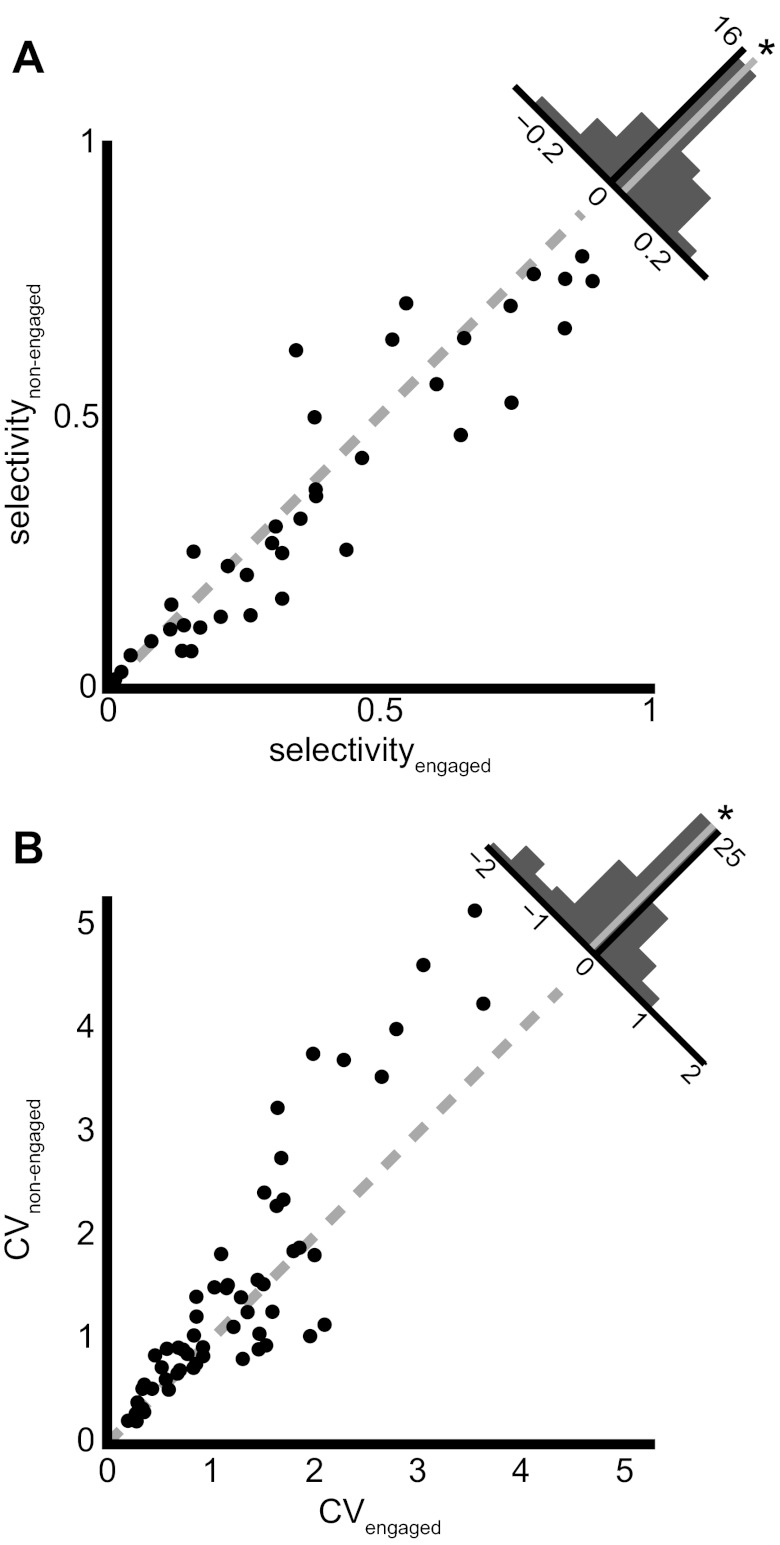
Fig. 5.
Firing rate variability decreases and stimulus selectivity increases during task engagement. A: scatterplot of the selectivity of a neuron to all presented stimuli in both the nonengaged (y-axis) and engaged (x-axis) behavioral conditions. The histogram at top right shows the difference in the selectivity between the engaged and nonengaged conditions. The median (gray line) is significantly shifted to the right (*); neurons show higher stimulus selectivity in the engaged condition. B: scatterplot of the mean of the coefficient of variation (CV) of trial-to-trial firing rate across all stimuli presented to a neuron in the nonengaged (y-axis) and engaged (x-axis) conditions. The histogram in top right corner depicts the distribution of the differences in CV between the engaged and nonengaged conditions. The median (gray line) is significantly shifted to the left (*); the trial-to-trial firing rate variability decreases when a bird engages in an auditory recognition task.

