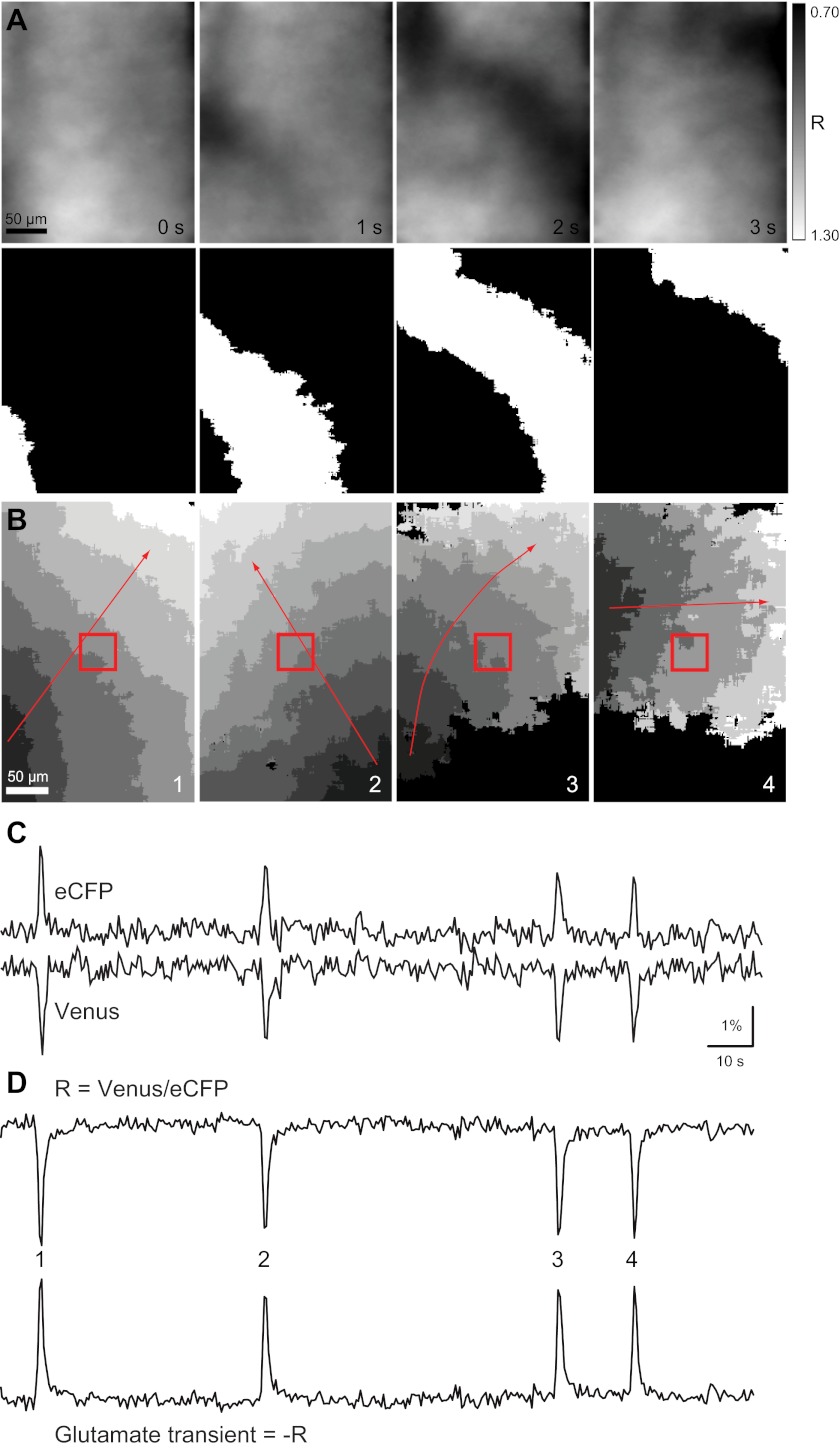
Fig. 1.
The fluorescence resonance energy transfer (FRET)-based glutamate sensor FLII81E-1μ detects coherent wave fronts of glutamate propagating through the inner plexiform layer (IPL) in postnatal day (P)10–P12 retinas. A: example of a single glutamate wave detected by FRET imaging of FLII81E-1μ in a P11 whole mount retina. The raw ratio data (top) and binarized version used for analysis (bottom) are shown. B: each image represents the spatial extent and duration of one glutamate transient. Within an image, each grayscale value represents the active area in one frame, with an imaging rate of 2 Hz. Dark gray is the first frame in which glutamate was detected, whereas white is the last. Black is baseline. Red arrows indicate the propagation direction. The red box is the area where ΔR/R was averaged to determine whether an increase in glutamate occurred in that region. C: example trace of raw fluorescence changes for enhance cyan fluorescent protein (eCFP) and Venus. D, top: resulting trace when the ratio of Venus to eCFP was taken. The downward peaks indicate the decrease in FRET when glutamate binds. Bottom, reflection of the top trace. The upward peaks indicate increases in glutamate. Numbered peaks correspond to the wave events shown in B.

