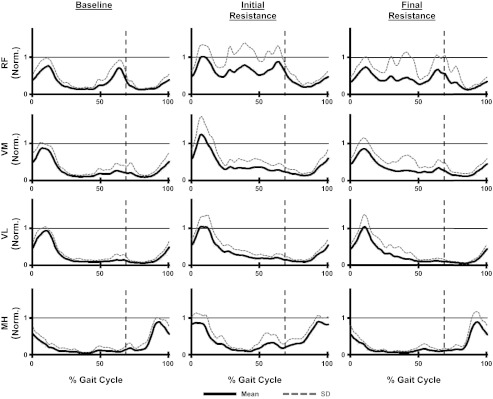
Fig. 6.

Mean and SD of step cycle EMG profiles calculated from all 10 subjects for the rectus femoris (RF), vastus medialis (VM), vastus lateralis (VL), and medial hamstring (MH) during the baseline, initial resistance, and final resistance time periods. EMG values were normalized to the peak value occuring during baseline. Vertical dashed lines indicate stance to swing transitions.
