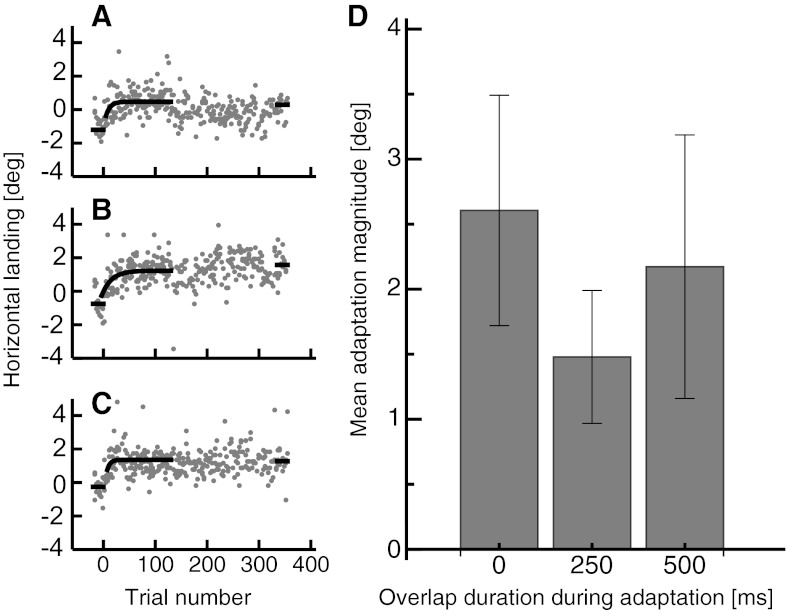
Fig. 2.
A: adaptation curve from a representative subject for an adaptation with 0-ms overlap duration between fixation point and saccade target. Black points represent horizontal saccade landing positions in preadaptation trials, and gray points represent horizontal saccade landing positions in adaptation trials. An exponential fit function is fitted to the first 150 adaptation trials (shown in black). Black lines indicate the median landing position in the pre- and the postadaptation trials. The postadaptation trials shown contain the reinforcement adaptation trials, which should keep adaptation at the steady level. B: adaptation curve from a representative subject for an adaptation with 250-ms overlap duration between fixation point and saccade target. Same conventions as in A. C: adaptation curve from a representative subject for an adaptation with 500-ms overlap duration between fixation point and saccade target. Same conventions as in A. D: mean adaptation magnitude from all 3 overlap duration sessions averaged across subjects. Error bars represent SE.

