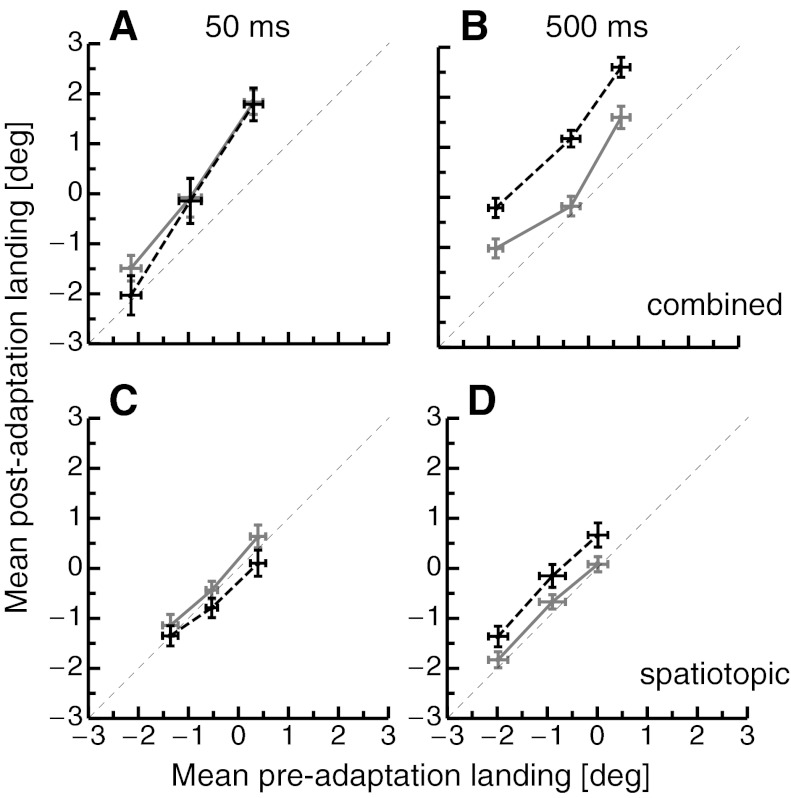
Fig. 3.
A: mean preadaptation landing vs. mean postadaptation landing positions averaged separately for all 3 jitter positions in the combined condition where saccade targets were shown for 50 ms. The gray solid line indicates data from adaptation sessions with 0-ms overlap, and the black dashed line represents data from adaptation sessions with 500-ms overlap. Error bars represent SE. B: landing positions in the combined condition where saccade targets were shown for 500 ms. Same conventions as in A. C: landing positions in the spatiotopic condition where saccade targets were shown for 50 ms. Same conventions as in A. D: landing positions in the spatiotopic condition where saccade targets were shown for 500 ms. Same conventions as in A.

