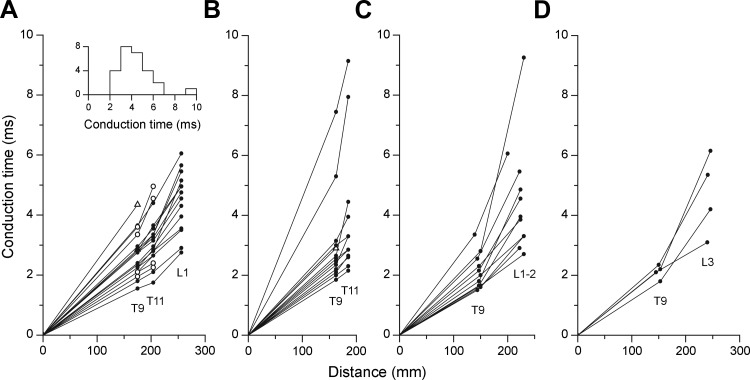
Fig. 2.
Axonal conduction times for EBSNs. Each graph shows the conduction times from individual EBSNs, calculated from the collision tests in the indicated segments and plotted against the distance from the medulla. A and B: measurements in the 2 control animals, used only for EBSN projection frequency and conduction time measurements (one animal in A, the other in B). Filled circles, antidromic identification at all sites tested; open triangles, units not activated from T11; and open circles in A, units not activated from L1. Inset in A shows a histogram of conduction times to L1 or rostral L2 (includes data from A and C). C and D: measurements from animals used for cross-correlation measurements. Only units antidromically identified from L1–L3 are included (“L1–2” refers to L1 or rostral L2). Data are from 3 animals in each of C and D.

