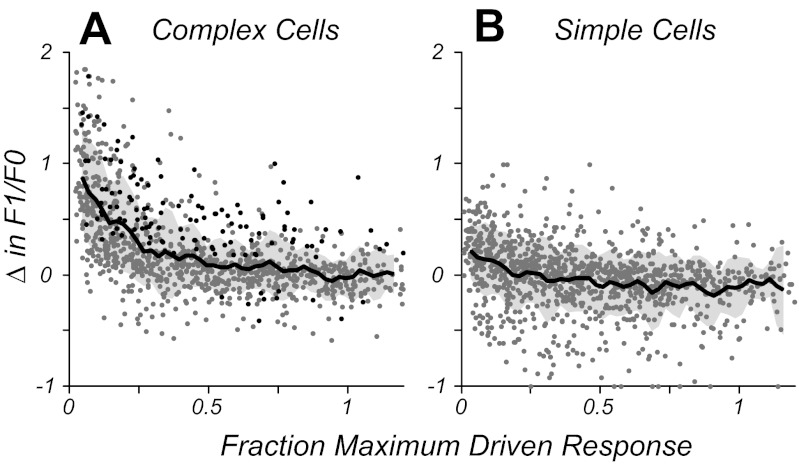
Fig. 4.
Population data showing how the change in F1/F0 ratio is related to the amount of response drive (normalized to the individual neuron's firing rate at high contrast). A: complex cells show little change in F1/F0 across 75% of their operating range (0.25–1) but increase at firing rates below 25% of the maximum response. Points in black show cells and conditions with a significant change in F1/F0 and a significant F1 component to the response. For a majority of cases, the increase in F1/F0 ratio at low drive is not significant and is due to the low firing rate. The solid black line shows the running average of all data points (gray-shaded region, ±SD) using a boxcar of 0.05 width. B: simple cells, as a population, show no systematic change in F1/F0 on average across their operating range.

