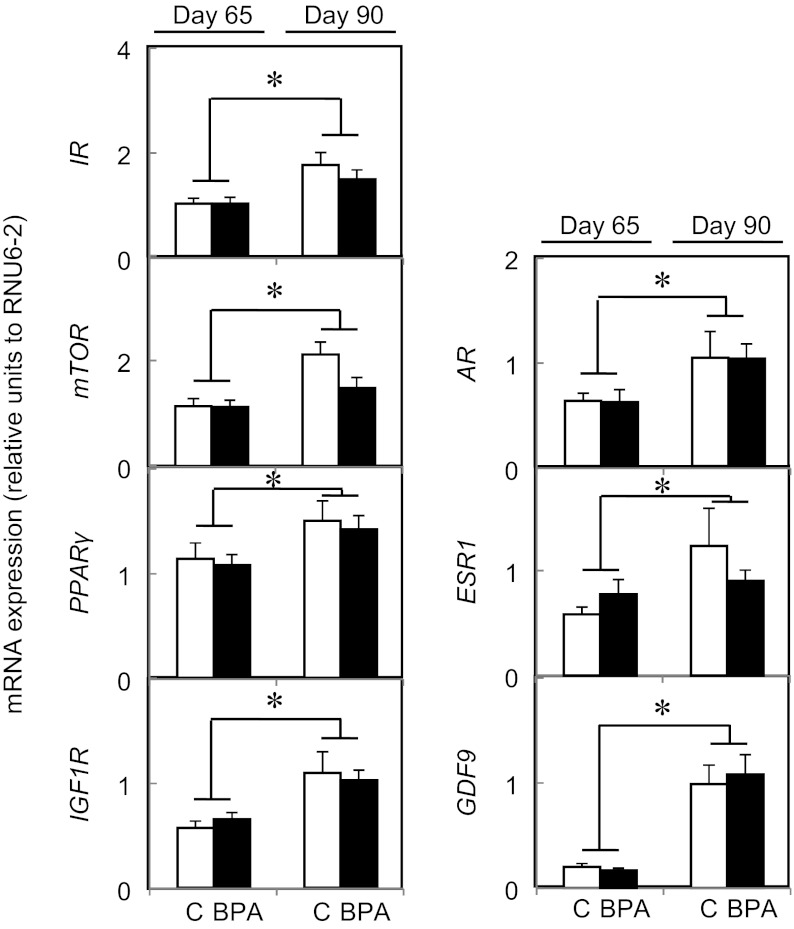
Figure 3.
Age-dependent changes in fetal ovarian steroid receptors, growth factors, and insulin-related gene expression between day 65 (left graph) and day 90 (right graph) of gestation in control (open bars) and BPA-treated (closed bars) females. Results of control and BPA-treated females were combined for testing age effects when there was no treatment effect within age. Asterisks represent statistical differences between ages (P < .005). Control (n = 4 and 5, respectively, at day 65 and day 90) and prenatal BPA-treated (n = 5, both ages) groups.

