
Fig. 4.
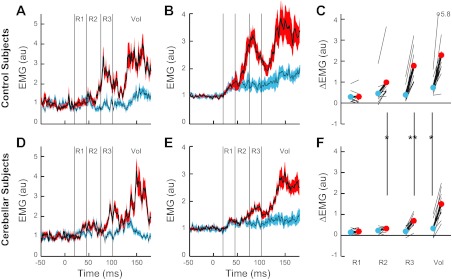
Evoked posterior deltoid activity during experiment 1. A: posterior deltoid activity from the exemplar control subject shown in Fig. 3, A and D. Black lines indicate mean activity, and colored outlines indicate SE after the shoulder flexor torque (red) and elbow extensor torque (blue). Thin vertical lines delineate the different time periods that we examined for compensatory muscle activity (R1, R2, R3, and Vol). B: average muscle activity and SE from normal group of subjects. C: evoked muscle activity within the 4 epochs. Thin black lines depict data from each subject (1 subject's data is out of range and presented numerically). Circles and thick black lines indicate the group mean. Horizontal line at 0 is the preperturbation muscle activity. D–F: posterior deltoid activity from the exemplar cerebellar subject shown in Fig. 3, B and E, and group of cerebellar subjects during experiment 1. Same format as in A–C. Vertical lines and asterisks spanning panels indicate significant difference between cerebellar and control groups for that epoch of activity and perturbation condition: *P < 0.05; **P < 0.01.