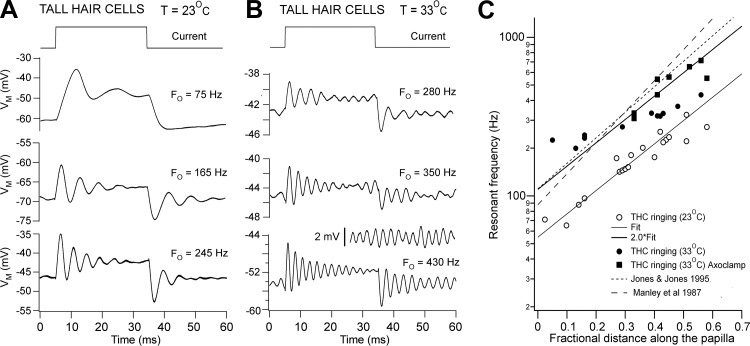
Fig. 2.
Electrical resonance in THCs. A: voltage (VM) responses of cells at 3 locations to extrinsic current steps; the resonant frequency at current onset (Fo) is shown above each of the averaged traces; T = 23°C. B: responses of 3 other cells at different locations to extrinsic current steps; Fo is shown above each of the averaged traces; T = 33°C. Inset: spontaneous oscillations in membrane potential for cell at bottom. In A and B, each voltage trace is the average of 10 presentations. C: collected results of resonant frequency plotted against THC location, expressed as the distance from the apical (distal) end normalized to the total length of the papilla. ○, T = 23°C; ● and ■, T = 33°C. The line through the points for T = 23°C is an exponential fit: FE = A·exp(d/λ), where A = 51 Hz and λ = 0.3 for 0 ≤ d ≤ 1. The fit was extended to the points at T = 33°C by multiplying by 2 (A = 102), which corresponds to Q10° = 2. All measurements were made on E19–E20 birds. ■, Obtained from recordings with Axoclamp-2A. Dashed lines are maps of characteristic frequency (CF) from auditory nerve fiber tuning curves from Manley et al. (1987) in P2 intact chickens and Jones and Jones (1995) in E19 birds at T = 39°C.

