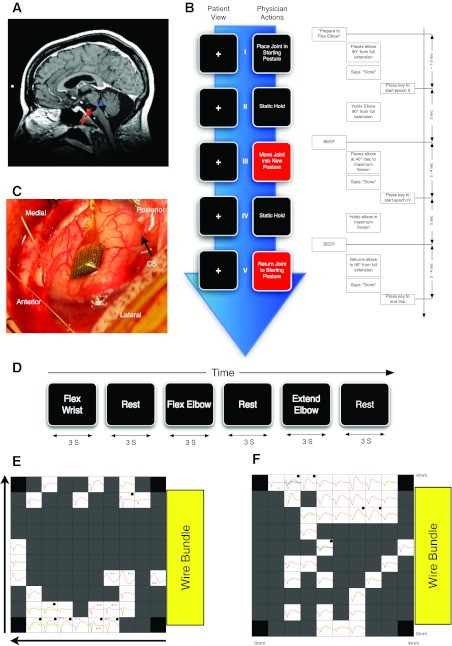
Fig. 1.
Methods. A: brain MRI before implantation showing location of lesion. The participant suffered a massive pontine stroke (red arrow) that affected most of the ventral descending tracts. The dorsal and lateral aspects of the pons where the spinal sensory pathways pass through that level of the pons were intact (blue arrowhead). B: timeline of 1 trial of the sensory manipulation task. The task was a block design with each block consisting of either 5 trials (session 1) or 10 trials (session 2) of 1 manipulation from the 15 different manipulations performed during the study. Arrow indicates passage of time. Left, the sequence of instructions relayed to the experimenter. Right, an exploded view of the timeline of 1 trial of elbow flexion block describing the auditory relay of instructions to the experimenter, the details of the experimenter performance of sensory manipulation, and the technician actions to mark the transitions between epochs of a trial. C: array placement during surgery (CS, central sulcus). D: details of attempted movement task as described in experimental procedures. E and F: maps of the average triggered waveforms on the array as viewed from above the cortical surface with the electrodes pointing down. Yellow box represents the position of the exit of the wire bundle. Horizontal arrow points in the anterior direction; vertical arrow points from lateral to medial. Each box represents the responses recorded from 1 electrode located at the corresponding spatial location. No electrodes were located at each of the 4 corners of the array, marked by black boxes. Dark gray boxes represent locations where an electrode was present but no waveforms could be isolated. On some channels, more than 1 unit was isolated and the average waveforms for those units are represented by different colors. All boxes have x-axis representing time with a range of 0 to 1.6 ms; the y-axis represents voltage. Two scales were used for the y-axis: boxes marked with a dot have a y-scale of ±100 μV; all other boxes have y-scales of ±50 μV. E shows data collected in session 1 (3/14/2007); in this session there were 3 cross-talk artifacts on channels labeled XT-1 through XT-3. F shows data collected in session 2 (3/19/2008).

