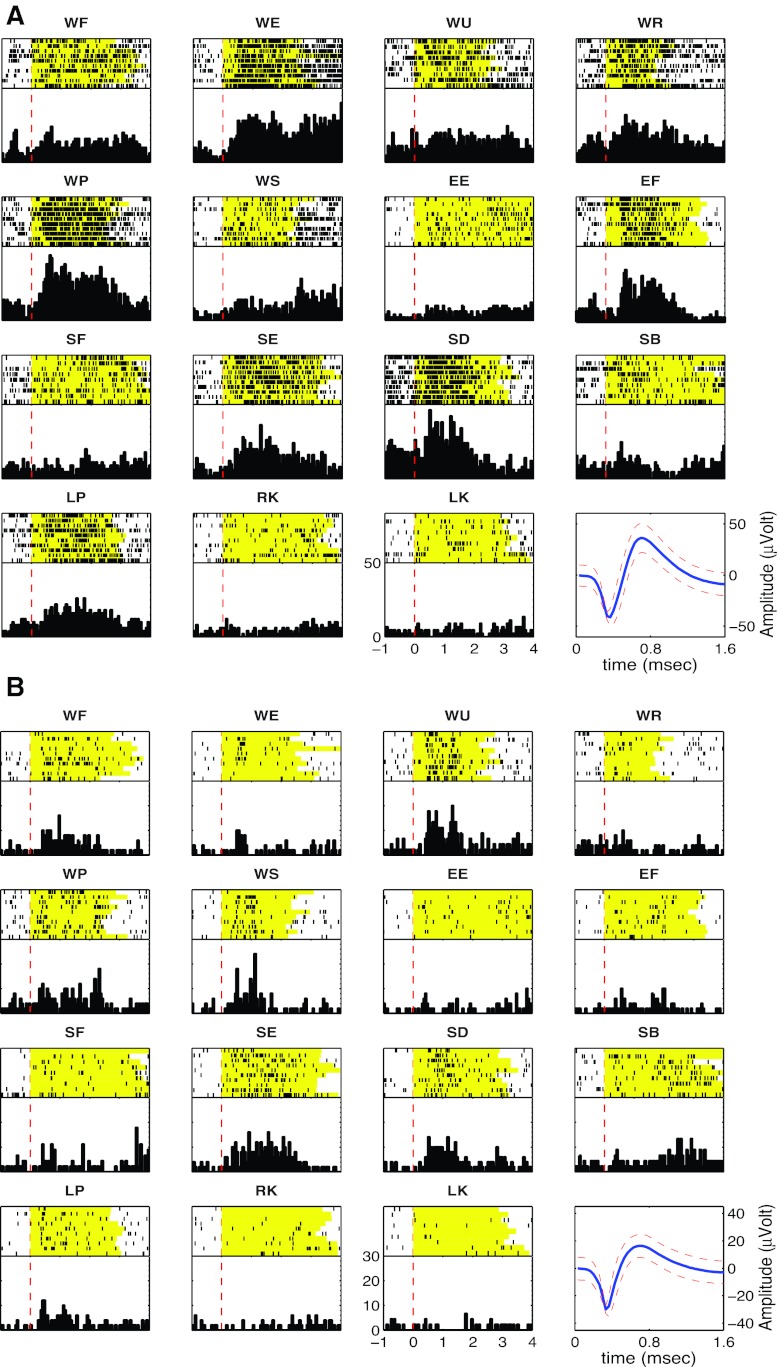
Fig. 3.
Example of rasters and peristimulus histograms (PSTH) from simultaneously recorded units with multiple joint responses to passive manipulation. The top part of each subpanel is a raster, with each row representing a trial and each dot representing a spike from the neuron. The yellow background indicates the duration of passive movement. Black dots represent discriminated spikes. All trials were centered at the time of auditory cue presentation to the experimenter (red dashed line). Bottom right subpanel shows the discriminated unit along with a confidence interval of 2 SD surrounding each amplitude time point of the waveform. A: unit (C8U1) shows responses to wrist, elbow, and shoulder. B: unit (C12U1) shows responses to wrist and shoulder only.

