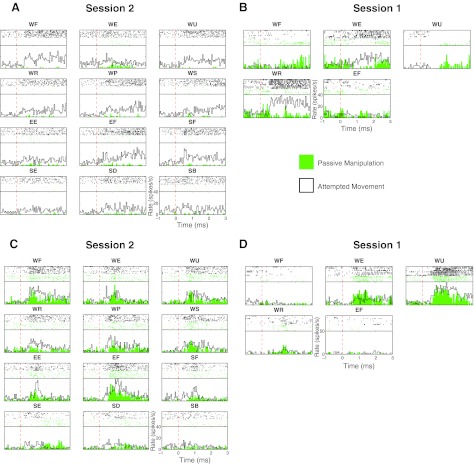
Fig. 5.
Comparison of sensory and attempted movement responses. PSTH and rasters were calculated from passive joint manipulations (green) and attempted movement (black outline with no fill) of the same joint and same direction of the passive manipulation. The movement direction is indicated above each raster and PSTH. A: responses of a unit in session 2 (C42U1) that was unresponsive during passive manipulation but responded strongly to attempted movement. Each subpanel shows the result of 10 trials of each attempted and passive movement. B: responses from a unit (C75U1) in session 1 showing differential responses to passive and attempted movement. In this session only 5 movements were attempted, and there were only 5 trials of each passive movement and 8 trials of each attempted movements. C: responses of a unit in session 2 (C13U2). D: responses from a unit in session 1 (C83U2). Both the units in C and D show very similar responses to passive and attempted movement.

