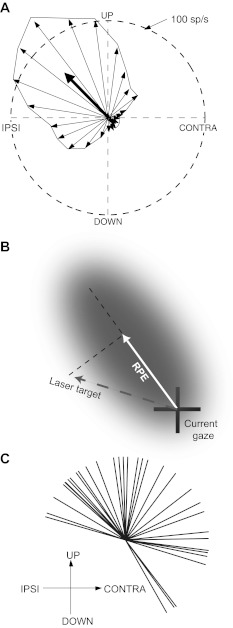
Fig. 1.
Procedure for deriving parabigeminal nucleus (PBN) response functions. A: illustration of how best direction of retinal position error (RPE) was determined, using data from 1 cell (cell 20 in Fig. 2). The orientation of each thin vector corresponds to 1 of 24 15° bins of angle between the area centralis and target; the length of each vector is proportional to the average activity evoked by targets in the corresponding bin. The best direction of RPE is determined by averaging the individual vectors, as shown by the heavy arrow. B: illustration of how the scalar value of target distance was calculated. The shaded area represents a hypothetical response field, and the dashed line passing through the center of the response field represents the best direction of RPE, as determined in A. Typically, the vector connecting gaze and target positions denotes RPE, but for purposes of deriving response functions here we define RPE as a scalar value, namely, as the projection of the target vector (dashed line) onto the best direction of RPE, i.e., the solid white vector. The sign of RPE is positive for the direction indicated and negative for the opposite direction. C: distribution of best directions of RPE of 36 PBN cells.

