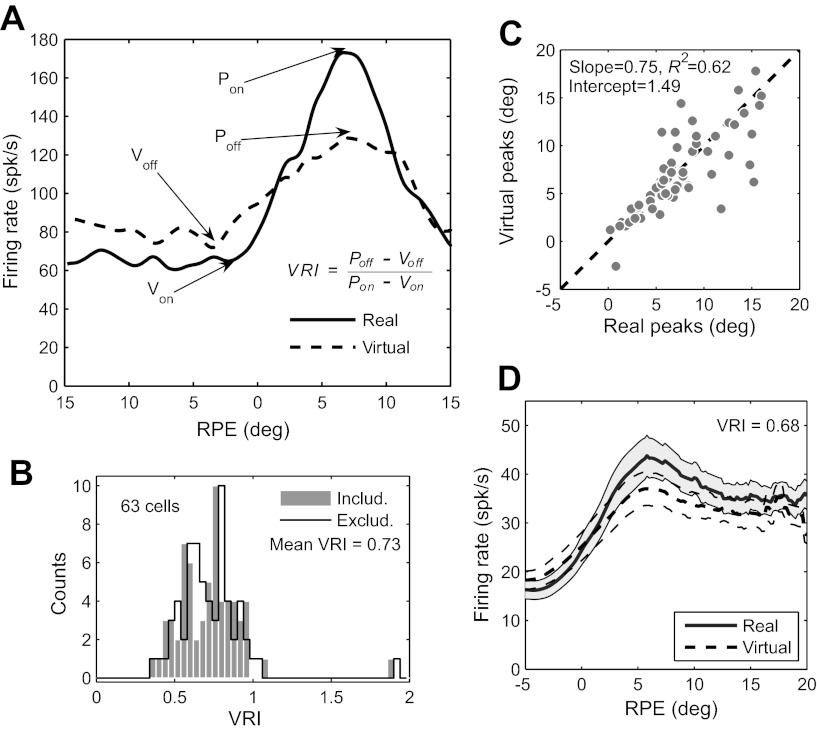
Fig. 4.
Results of blinking-target task. A: definition of virtual response index (VRI), illustrated with response functions for real and virtual targets of the same cell in Fig. 3. Pon and Von mark peaks and valleys of the response function for the real target (i.e., the ON phase of the target), while Poff and Voff mark the peaks and valley for the virtual target (i.e., the OFF phase of the target). The VRI is the ratio of the dynamic ranges of the two response functions: VRI = (Poff − Voff)/(Pon − Von). B: frequency histograms of VRI for 63 PBN cells, including and excluding saccades. The mean VRI was identical (0.73) for both. The results of all analyses of the virtual response were also essentially identical with and without the inclusion of saccades, and for subsequent figures we arbitrarily chose to include saccades. C: locations of peaks of response functions compared for real and virtual targets. The dashed line indicates unity slope and zero intercept. For each cell, the eccentricity of the peak RPE for the virtual target is plotted against that of the real target. The distributions of peak eccentricities for real and virtual targets do not differ significantly (P = 0.93); the slope and intercept are not significantly different from unity and zero, respectively (P = 0.27 for slope, 0.61 for intercept). D: grand average RPE response functions for real and virtual targets, calculated for the full 400-ms ON and OFF phases: VRI is 0.68. Firing rates are averaged across the entire sample of PBN cells (n = 63). SE is shown for real and virtual targets by shading and dashed lines, respectively.

