Fig. 9.
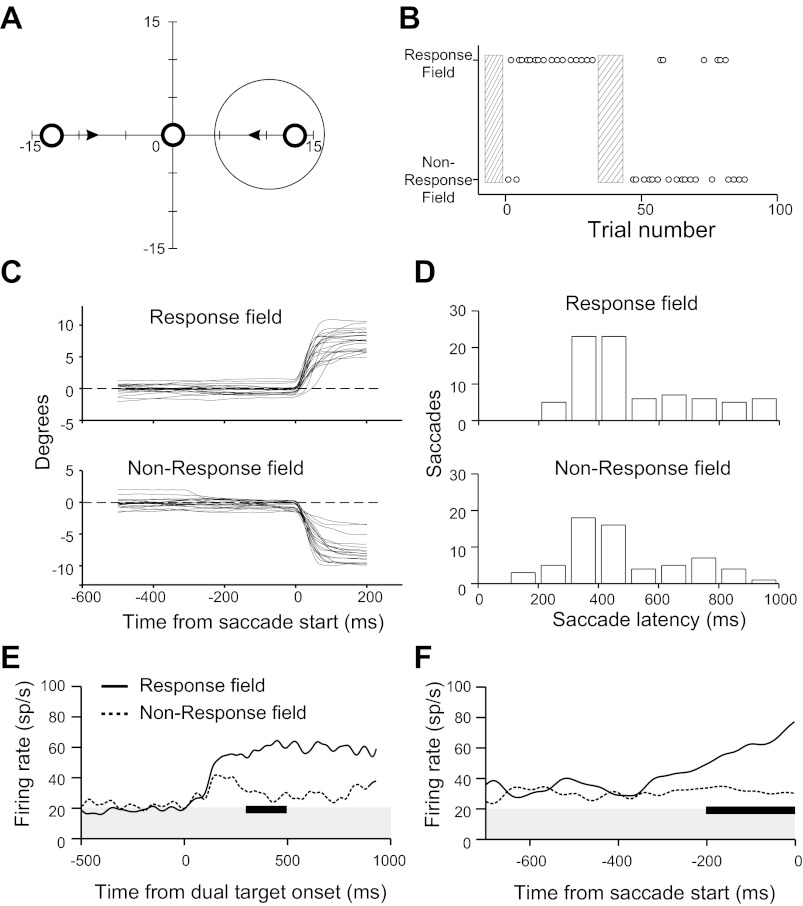
PBN activity during dual-target task. A: schematic of task. Large circle represents PBN response field. At trial start cats fixated a laser spot centered on the display. One second later, that spot went off and 2 targets (laser spots) appeared at locations indicated by small open circles, moving centrally at 2°/s, as indicated by arrows. A saccade to either target terminated the trial. B: cat's choices of target (indicated by small circles) in 1 of the 4 recording sessions that contributed to the data. Hatched bars encompass trials in which the animal was encouraged to choose one target over the other (see text), which in this case shifted its predominant choice from the target appearing in the response field to the target appearing opposite to the response field. The trials used to bias behavior did not contribute to the analyzed data; for all other trials the animal was rewarded for a successful saccade to ether target. C: horizontal eye positions for saccades toward and away from the response field for the session illustrated in B. D: distributions of latencies (from target onset) of saccades made toward and away from the response field. All data from the 4 multiunit recording sessions that contributed to the results are included in these panels and in E and F. E and F: summed activity synchronized on target onset (E) and saccade start (F) for saccades toward (solid line) and away from (dotted line) the response field, smoothed with a Gaussian filter (SD = 12 ms). Activity baselines, marked by the gray area in E and F, are the average firing rates in the 500-ms interval before target onset. The difference in activity between the 2 saccade directions in the intervals marked by the dark bars are significant (2-sample Kolmogorov-Smirnov test) for both E (P < 0.0001 for the 200-ms interval from 300 to 500 ms after target onset) and F (P < 0.0001 for the 200-ms interval before saccade onset). The interval for statistical analysis in E was chosen because the data density was highest for this interval (see D).

