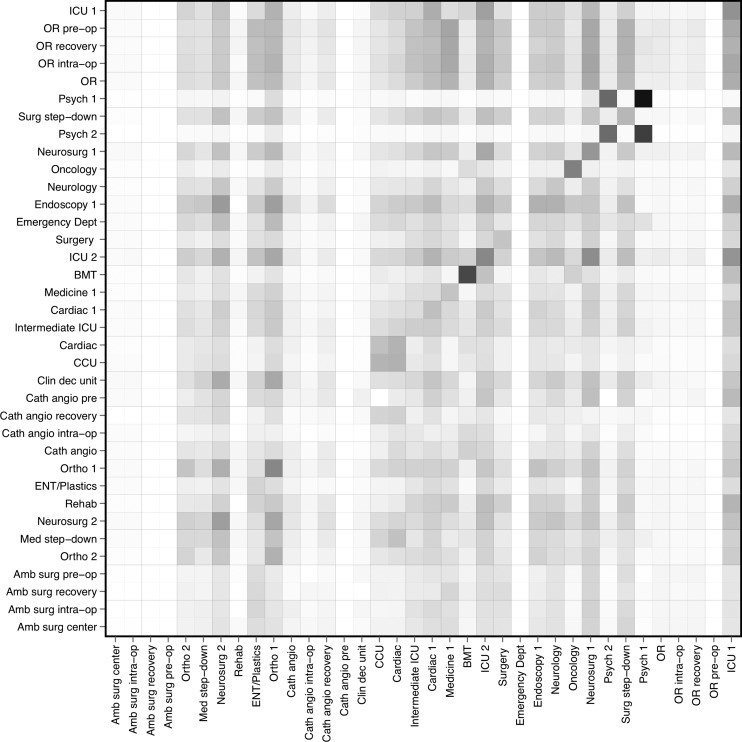
Figure 3.
Matrix showing the probabilities for spread of influenza between wards. The rows are the source departments and the columns are the target departments. The shading in each cell indicates the probability of disease transmission from the ward indicated by the row, to the ward indicated by the column, with darker cells reflecting higher probabilities. BMT, bone marrow transplant; CCU, coronary care unit; ICU, intensive care unit; OR, operating room.

