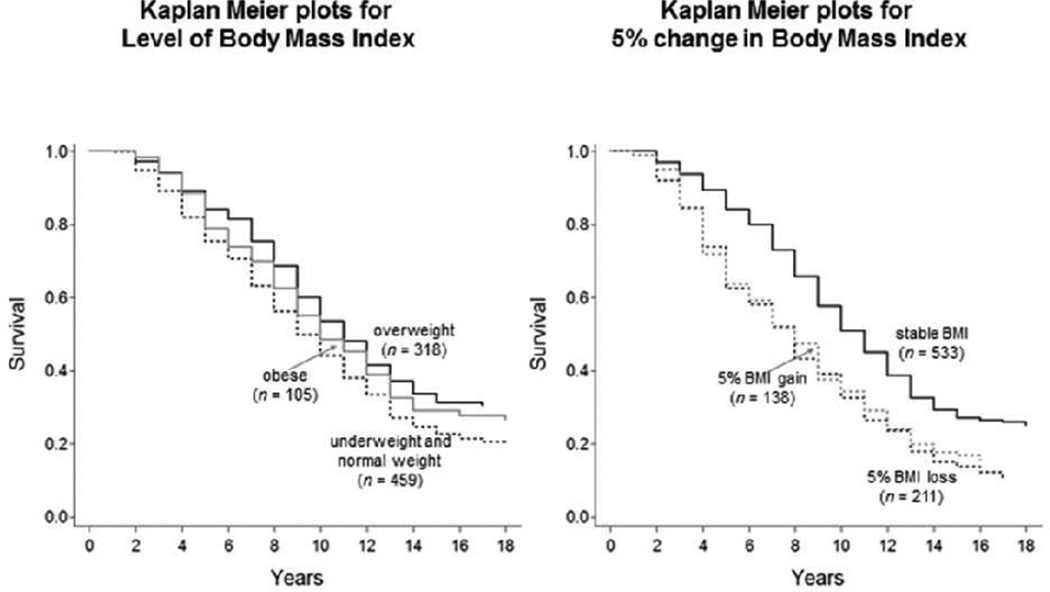
Figure 1.
Survival probabilities over 18 years are shown for groups of older Swedish participants with different levels and rates of change in Body Mass Index. The left-hand Panel illustrates that hazard ratios of mortality were lower for overweight participants relative to those underweight or with normal weight. Average group differences in survival time amount to almost a full year, after residualizing for age, gender, education, and comorbidities. The right-hand Panel shows that hazard ratios of mortality were higher for participants with 5% loss in BMI relative to those with stable BMI. Average group differences in survival time amount to more than a full year, after residualizing for age, gender, education, and comorbidities.

