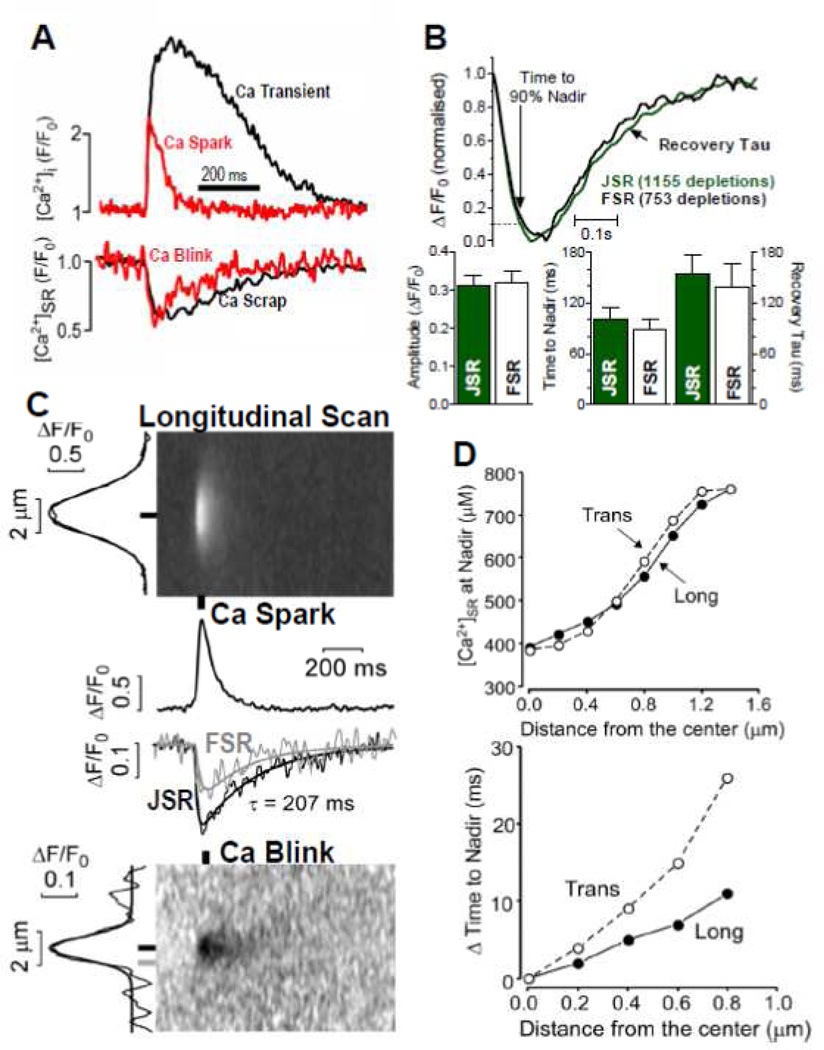
Figure 3.
Ca sparks and blinks with spatiotemporal resolution. A. Simultaneous measurements of a Ca transient and Ca scrap during ECC (black) and during a Ca spark and blink (modified from Zima et al. [24]. B. Kinetics and amplitude of Ca scraps measured at the Z-line (JSR) and mid sarcomere (FSR) showing average of indicated depletions and mean data in bar graphs. C. Simultaneous recordings of Ca spark and blink showing x-t images for longitudinal scans, time-dependent plots at the indicated locations and spatial width (at left edge) at indicated time. D. Distance-dependence going from Z-line to M-line of [Ca]SR and delay time for blink nadir (vs. that at the JSR). Averages of 37 traces. (B–D are modified from Picht et al. [25] with permission).

