
Figure 5. Variation within and between the communities of skin, oral, and fecal samples from humans and dogs.
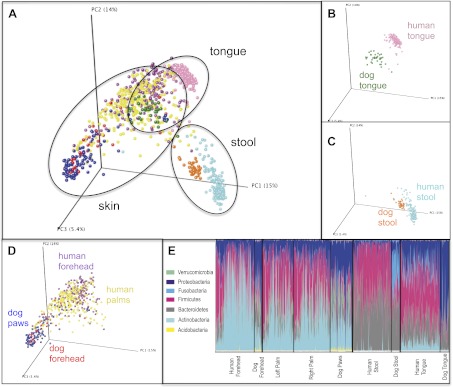
Panel (A) shows a PCoA plot of all the body habitats, using unweighted UniFrac distances of human and dog samples, rarefied at 5000 sequences/sample. Panels (B–D) show select body habitats from the full plot. Panel (E) shows a summary of the taxa shaded by relative abundance at the phylum level broken down by specific body habitat; the seven most abundant taxa are shown in the legend.