
Figure 3. Comparison of kataegic mutations in yeast AID/APOBEC transformants with those in breast cancers.
(A) Comparison of the length, number of mutations and polarity of yeast kataegic clusters with those in breast cancers. The degree of strand polarity is indicated by colour intensity. The breast cancer data (Nik-Zainal et al., 2012) are a compilation from three tumours (PD4103a, PD4107a, PD4199a) chosen for their large number of clusters. (B) Context of the genome wide mutated C bases in yeast AID/APOBEC transformants with total numbers of mutations in each dataset indicated. (C) Context of the kataegic and singlet mutated C bases in selected breast cancers. Analyses of all sequenced breast cancers are presented in Figure 3—figure supplements 2–4. (D) Similarity of sequence contexts of C mutations in breast cancer kataegic stretches compared to those of deaminase-induced C mutations in yeast. (D1) Identity of the base at the −2 position of TC mutations in cancer kataegic regions and in APOBEC3A/B yeast transformants. The base compositions were normalised to the genomic base composition of the −2 base at TC dinucleotides. (D2) Sequence contexts similarity p-value at positions (−1 plus −2) to the mutated Cs. The contexts of all Cs throughout the yeast and human genomes are included for comparison. Mutation context of wild type versions of AID and APOBEC3G are shown in Figure 3—figure supplement 1. Analysis of additional yeast transformants and breast cancers is shown in Figure 3—figure supplements 2–4.
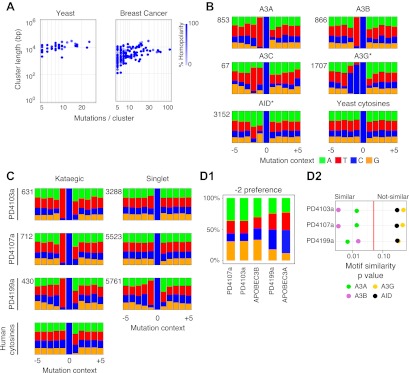
Figure 3—figure supplement 1. Mutation context of hyperactive APOBEC3G and AID are identical to the wild type proteins.

Figure 3—figure supplement 2. Analysis of kataegic stretches and mutation distributions of 21 breast cancers.

Figure 3—figure supplement 3. Analysis of kataegic stretches and mutation distributions of 21 breast cancers.

Figure 3—figure supplement 4. Analysis of kataegic stretches and mutation distributions of 21 breast cancers.
