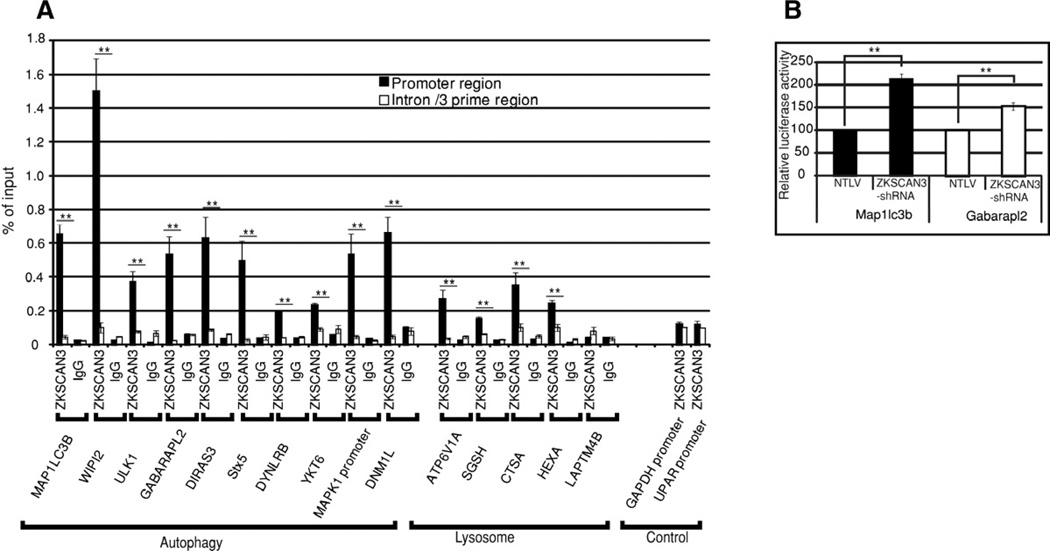
Figure 5. ZKSCAN3 directly interacts with the regulatory region of autophagy and lysosome genes.
(A) qRT-PCR followed by chromatin immunoprecipitation assay (ChIP assay) was performed using primers mapping to regulatory or intron regions of autophagy and lysosome genes and DNA precipitated with ZKSCAN3 or IgG antibodies. The graph displays the amount of the immunoprecipitated DNA expressed as a percentage of the total input DNA. Gapdh and uPAR gene promoters were used as control. qRT-PCR with each primer set was performed in triplicate in two separate experiments. (B) Expression of Map1lc3b and Gabarapl2 promoter-driven luciferase reporters was induced in ZKSCAN3-shRNA compared to control NTLV cells in dual luciferase assays. The data represent mean ± s.d. of two experiments performed in triplicate (6 values). **P < 0.05.

