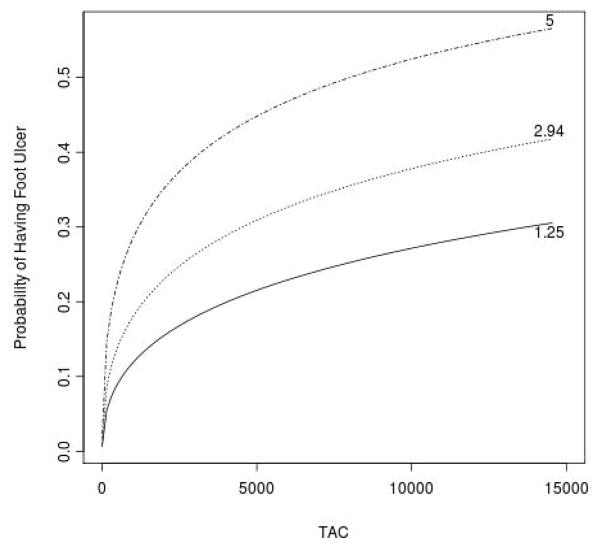
Figure 1.
(A). Box and whiskers plot (whiskers denote min and max) of TAC scores in patients without and with chronic foot ulcers at presentation. (B). Relationship between TAC score and the probability of having foot ulcer among patients in the twenty-fifth (1.25), median (2.94), and seventy-fifth (5.0) percentile of peripheral occlusion index.

