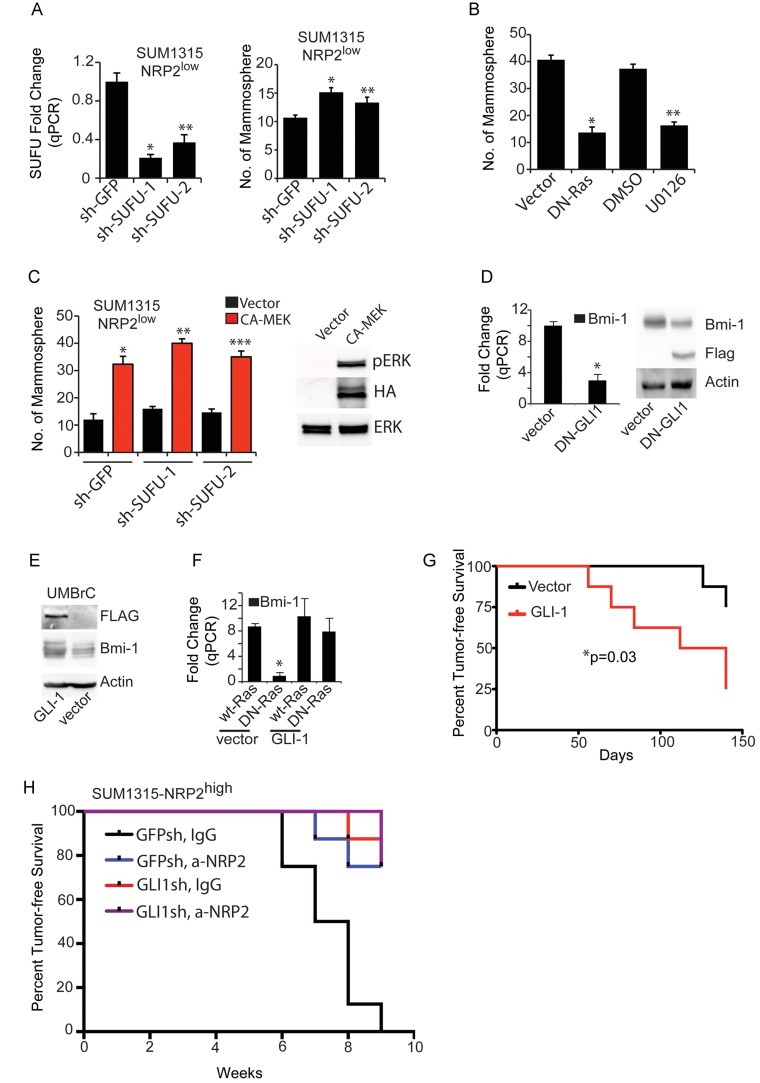
Figure 7.
NRP2/Ras regulate GLI1 predominantly by the ERK pathway.
A. The effect of SUFU downregulation on SUFU mRNA expression (*p = 0.001; **p = 0.001) and mammosphere formation (*p = 0.01; **p = 0.03) was measured in the NRP2low population of SUM1315 cells.
B. The NRP2high population of SUM1315 cells was either transfected with DN-Ras or treated with the MEK inhibitor U0126 and mammosphere assays were performed (*p = 0.0001; **p = 0.0002).
C. The NRP2low population of SUM1315 cells expressing either GFPsh or SUFU-sh was transfected with either control vector or CA-MEK and mammosphere assays were performed. Immunoblot shows expression of HA-tagged CA-MEK (*p = 0.001; **p = 0.0003; ***p = 0.001).
D. A Flag-tagged dominant negative GLI1 construct (DN-GLI1) was expressed in SUM1315 cells and the effect on BMI-1 mRNA and protein expression was determined (*p = 0.001).
E. A GLI1 construct was expressed in the NRP2low population of epithelial cells freshly isolated from breast cancer biopsies (UMBrC) and the effect on BMI-1 expression was measured by immunoblotting (*p = 0.0003).
F. A GLI1 construct was expressed in the NRP2low population of SUM1315 cells that also expressed either wild-type or DN-Ras, and the effect on BMI-1 mRNA expression was quantified by qPCR.
G. The NRP2low population of SUM1315 cells that expressed either a vector control or a GLI1 construct (8 mice per group) were implanted in the mammary fat pads of NSG mice and tumour formation was assessed by palpation. The curve comparison was done using the Log-rank test (*p = 0.03).
H. The NRP2high population of SUM1315 cells that expressed either GFP-sh or GLI1-sh was implanted in the mammary fat pads of NSG mice and treated with IgG or a-NRP2 (8 mice per group). Tumour formation was assessed by palpation. The curve comparison was done using the Log-rank test (*p = 0.0001). Error bars represent the mean ± SD for the in vitro experiments. Statistical differences between data groups were determined using Student's t-test.

