Figure 1.
Intrinsic differentiation potential and functional interactions between MuSCs and FAPs in MDX mice at different stages of disease.
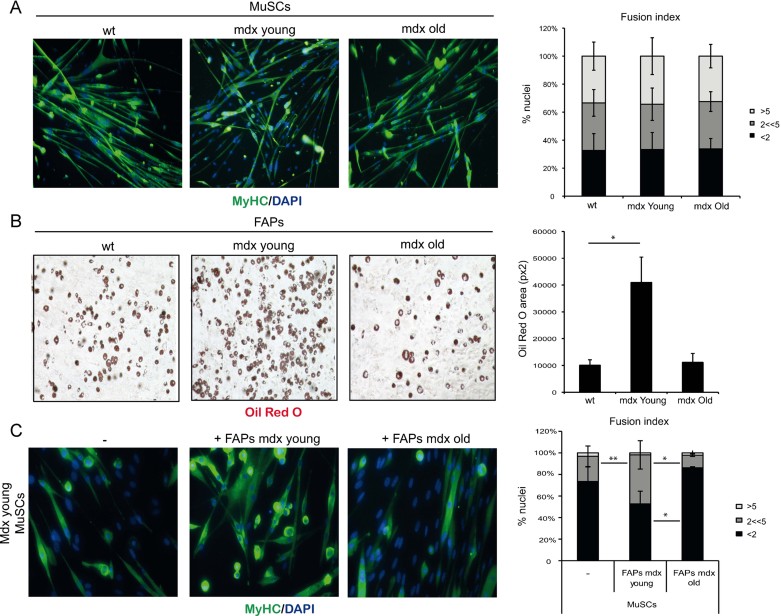
A. MuSCs isolated from hindlimbs muscles of wild type (wt) mice or mdx mice at early (mdx Young, 1.5-month old) or late (mdx Old, 12-month old) stages of disease progression (n = 3). Left panel: the myogenic potential of MuSCs was assessed by MyHC immunofluorescence. Representative images of MyHC (green) staining are shown. Nuclei were counterstained with DAPI (blue). Right panel: graph showing the quantification of fusion index. We measured the percentage of nuclei that were MyHC− or MyHC+ in mononucleated myotubes (<2), the % of nuclei that were inside myotubes containing between 2 and 5 nuclei (2 << 5) and the % of nuclei inside myotubes containing more than five nuclei (>5). Data are represented as average ± SEM.
B. FAPs were isolated from hindlimbs muscles of wild type (wt) mice or mdx mice at early (mdx Young, 1.5 month old) or late (mdx Old, 12 month old) stages of disease progression (n ≥ 3). Left panel: the adipogenic potential of FAPs was measured by Oil red O staining after 7 days of culture in growth medium and subsequent 6 days culture in adipogenic differentiation medium (adp-DM). Right panel: graph showing the quantification of red oil area, reported as pixel2/field. Data are represented as average ± SEM; statistical significance assessed by t-test, *p < 0.05.
C. Left panel: The ability of FAPs, isolated from either young (middle panel) or old (right panel) mdx mice, to enhance MuSC ability to form myotubes was determined by MyHC staining after 7 days of co-culture in growth medium. Right panel: graph showing the quantification of fusion index. We measured the percentage of nuclei that were MyHC− or MyHC+ in mononucleated myotubes (<2), the % of nuclei that were inside myotubes containing between 2 and 5 nuclei (2 << 5) and the % of nuclei inside myotubes containing more than 5 nuclei (>5). Data are represented as average ± SEM, (n = 3). Statistical significance tested by one-way ANOVA; *p < 0.05, **p < 0.01.

