
Figure 6.
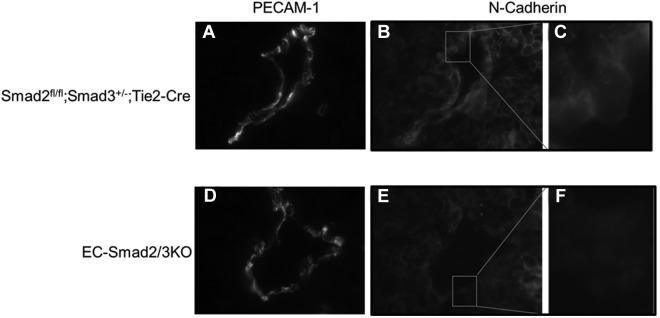
Immunohistochemical analysis of N-cadherin expression in DA of E10.5 embryos. Transverse frozen sections of Smad2fl/fl;Smad3+/−;Tie2-Cre (A-C) and EC-Smad2/3KO embryos (D-F) were stained with anti–PECAM-1 (A-D) and anti–N-cadherin antibodies (B-C,E-F). In panels C and F, the square areas in panels B and E are shown at higher magnifications, respectively.