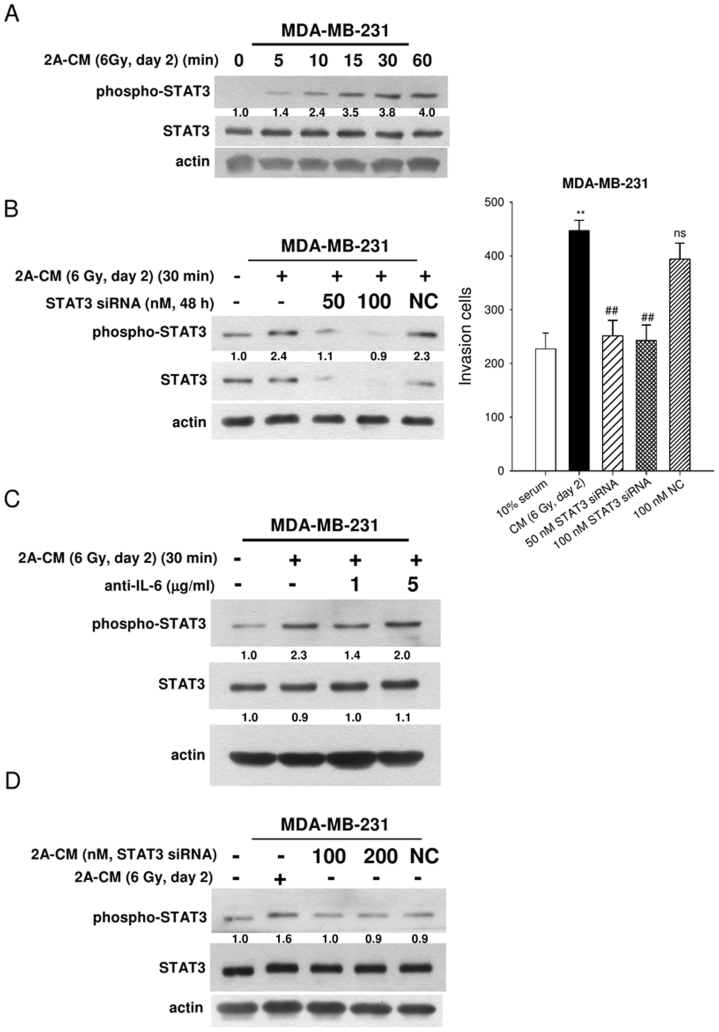
Figure 4. The role of IL-6/STAT3 in 2A-CM-induced cell invasion.
(A) MDA-MB-231 cells were treated with 2A-CM for 0–60 min. The levels of phospho-STAT3 and total STAT3 were examined through western blot analyses. (B) MDA-MB-231 cells were transfected with scrambled (NC) or STAT3 siRNA followed by 2A-CM treatment. The levels of phospho-STAT3 and total STAT3 in MDA-MB-231 cells treated with 2A-CM were examined by western blot analyses (left). The effects of cell invasion were analysed using a Boyden chamber assay (right). The population of invading cells was quantified. A p value of <0.01 (**) indicates significant differences between CM-treated and untreated samples. A p value of <0.01 (##) indicates a significant difference between CM from non-transfected and siRNA-transfected cells. (C) The effects of neutralisation with an IL-6 antibody on levels of phospho-STAT3 in non-irradiated MDA-MB-231 cells were examined by western blot analyses. (D) MDA-MB-231-2A cells were transfected with scrambled (NC) or STAT3 siRNA followed by radiation. The MDA-MB-231 cells were treated by 2A-CM from non-transfected and siRNA-transfected cells. The levels of phospho-STAT3 were examined by western blot analysis. Quantification of western blot bands was performed using densitometry, and the phospho-STAT3/STAT3 ratio to actin is indicated. In (C), the STAT3/actin ratio is also indicated.

