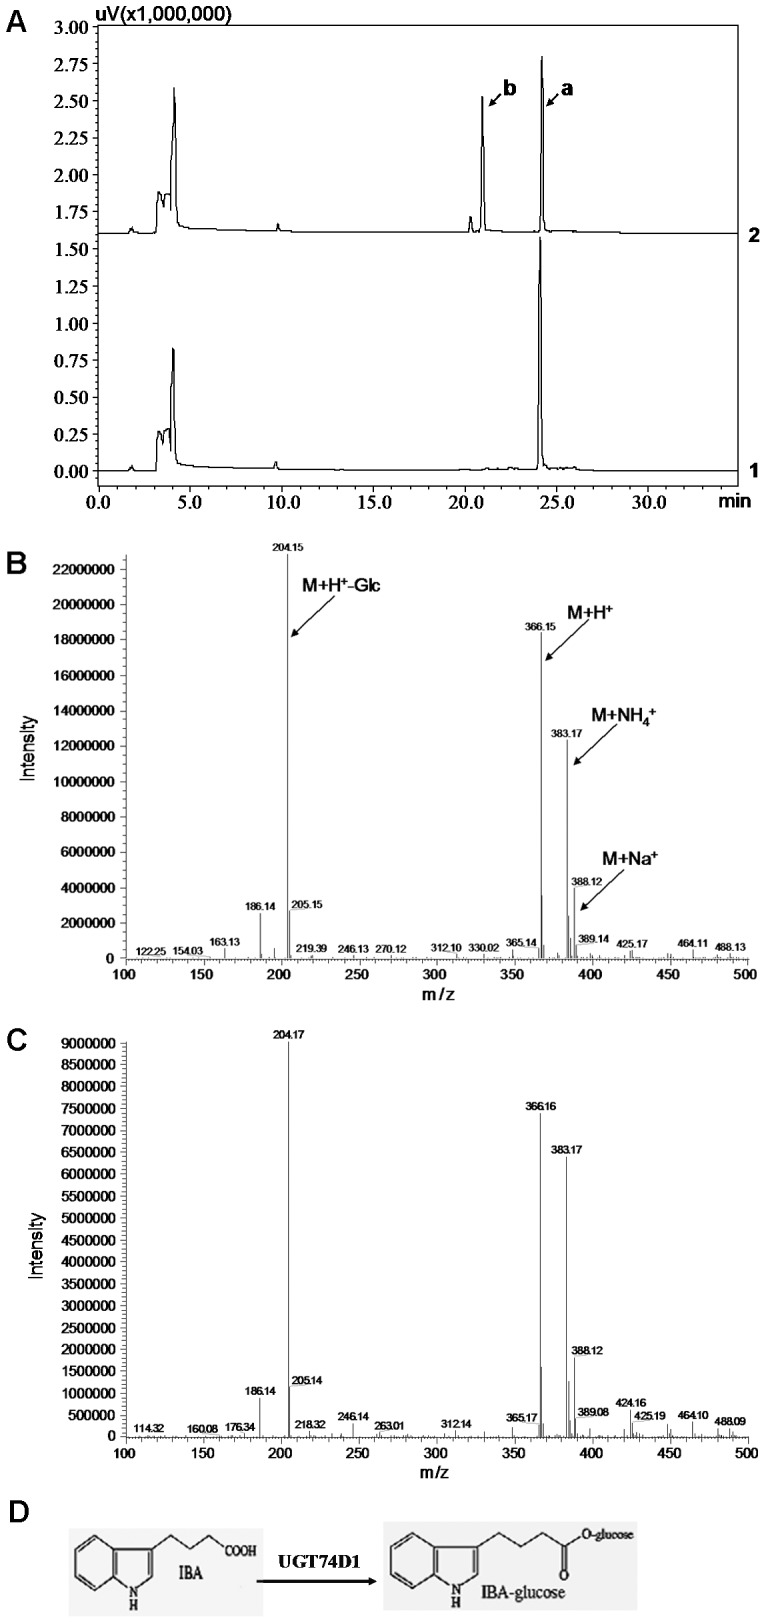
Figure 3. HPLC and LC-MS analysis of reaction product from IBA.

(A) HPLC analysis. 1: the reaction was added with GST protein as control. 2: the reaction was added with UGT74D1 fusion protein and a new peak (peak b) was produced. Peak “a” represents the substrate IBA. (B) LC-MS analysis of peak b. (C) LC-MS analysis of IBA glucose conjugates produced by the catalysis of UGT74E2 which was used as positive control in this research. (D) Proposed enzymes and biosynthetic pathway for the synthesis of IBA-glucose ester from the aglycone IBA.
