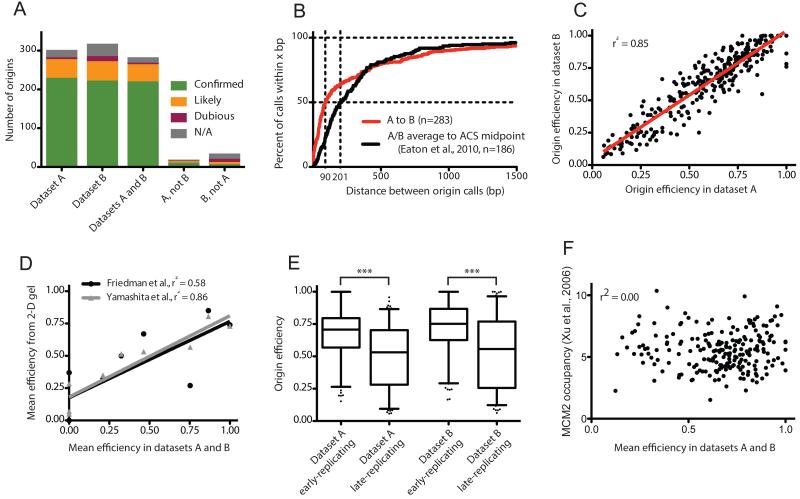
Figure 2. Validation of replication origins identified from Okazaki fragment sequencing, and global evaluation of origin efficiency across replicate datasets.
(A) Identified origins correspond well with previous reports. Column graphs indicate the number of origins identified in replicate datasets lying within ±2.5kb of OriDB (Nieduszynski et al., 2007) origins listed as ‘confirmed’, ‘likely’, or dubious: N/A indicates an origin that is not within 2.5 kb of any OriDB entry. Origins within 5kb of one another in replicate datasets were deemed to be the same.
(B) Origins are accurately identified in replicate datasets. The percentage of the 284 matched origin pairs called less than x bp apart in replicate datasets is plotted in red on the Y axis: median distance between matched origins is 90 bp. 186 origins lie within ±2.5kb of an ACS sequence corresponding to an active origin (Eaton et al., 2010); the black line represents the percentage of these origins within x bp of the ACS midpoint, and has a median of 201 bp.
(C) Origin efficiencies are consistent in replicate datasets. The red line corresponds to a linear regression.
(D) Origin efficiencies agree well with values determined by 2-D gel electrophoresis. Mean efficiencies calculated biochemically for origins across chromosome 6 (Friedman et al., 1997; Yamashita et al., 1997) are compared to mean efficiencies for the corresponding origins across our two datasets. Origins not detected in our analysis are assigned an efficiency of zero. Lines correspond to linear regressions.
(E) Origins in early-replicating regions of the genome are significantly more efficient than those in late-replicating regions: origins were ranked by trep (Raghuraman et al., 2001) and divided into bins above and below the median value; p<0.0001 for each dataset. Box represents lower quartile, median and upper quartile; whiskers denote the 5th and 95th percentiles.
(F) Origin efficiency does not correlate with Mcm2 ChIP. Mean origin efficiency for origins identified in replicate wild-type datasets and within 2.5kb of Mcm2 ChIP peaks (Xu et al., 2006), is plotted against Mcm2 occupancy.
See also Fig. S4.

