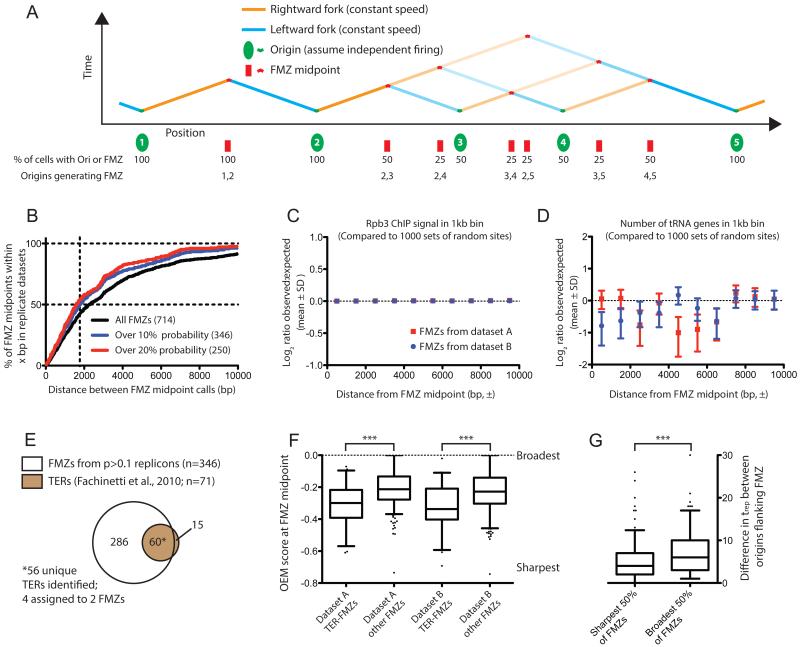
Figure 4. Global analysis of replication fork mergers.
(A) Schematic depiction of FMZ midpoint location and probability for a hypothetical chromosomal region containing origins with various efficiencies.
(B) The midpoints of moderate and high-probability FMZs can be reproducibly identified. For FMZs identified in replicate datasets (within 5kb). The percentage of replicate FMZ midpoints less than x bp apart is plotted on the Y axis. Probability cutoffs of 0 (black line), 10% (blue) or 20% (red) are shown. The 346 FMZs with efficiency over 10% in each replicate dataset (i.e. present in >10% of cells in the population) were used for subsequent analyses.
(C) Sites of high transcription are not enriched around FMZs. For FMZs in either dataset A or dataset B calculated to have probability >10% (n=511 for dataset A, 536 for dataset B), the total Rbp3 ChIP signal from (Fachinetti et al., 2010) was calculated in 1kb bins up- and downstream of the FMZ midpoint; an identical analysis was carried out for an equal number of (i.e. 511 or 536) of random genomic sites, and the ratio of signal around FMZs to signal around random sites (i.e. observed:randomly expected) calculated in each bin for each sample; this process was iterated 1000 times. The Log2-transformed ratio of observed:expected is plotted (mean ± SD) for the 1000 iterations of random sites. FMZs from dataset A are plotted in red; those from dataset B are in blue. Error bars are too small to be visualized in this plot. Significant deviation above zero, which would indicate enrichment of RNA PolII around FMZs, is not observed.
(D) tRNA genes are not enriched around FMZs. Analysis is identical to that in (C), but follows the presence of tRNA genes around FMZs or random genomic sites. As in (C), significant deviation above zero is not observed.
(E) FMZs identified by our analysis encompass the majority of TER regions previously identified (Fachinetti et al., 2010). 56 of 71 TERs were located within ±5kb of at least one calculated FMZ midpoint: 4 TERs were assigned to two FMZs, as they could not be unambiguously assigned to a single one.
(F) FMZs previously identified as TERs are generally sharper than bulk FMZs. The OEM score at the FMZ midpoint is plotted (p<0.0001 for each dataset). OEM negatively correlates with FMZ sharpness: a theoretical point terminator between origins that invariably fire will give rise to an OEM of −1, while 0 indicates no termination or origin activity (cf. Fig 1 C&D).
(G) Origins flanking sharp FMZs fire at approximately the same time. FMZs were binned by mean OEM score across two datasets. The difference between trep values for each origin in the replicon is plotted (p<0.0001 by t-test). Note that for origins with efficiency >0.5, half-maximal replication time (i.e. trep) is equivalent to average firing time.
See also Fig. S5.

