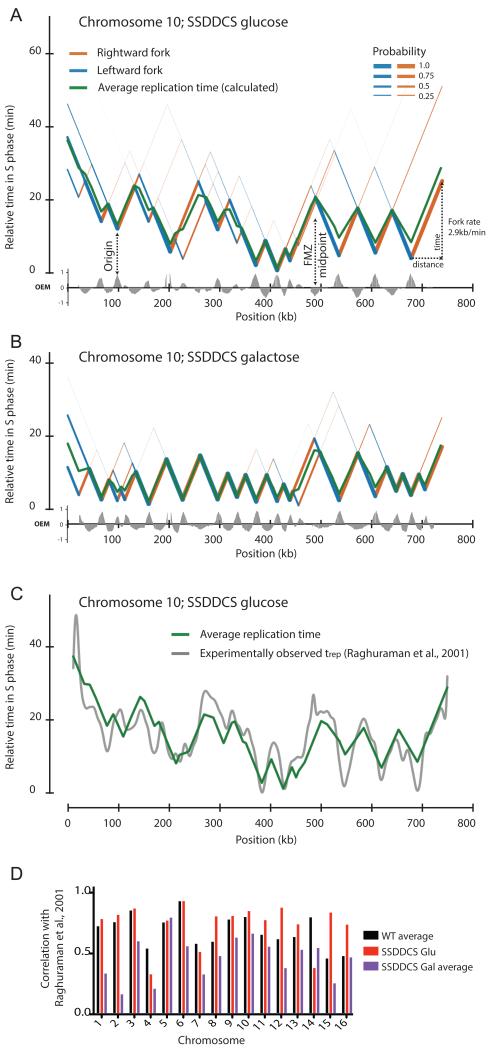
Figure 7. Reconstruction of chromosome-wide replication profiles from Okazaki fragment sequencing data obtained from asynchronous cultures.
(A&B) Using the algorithm described in the methods section, and assuming a constant fork speed of 2.9kb/min (Raghuraman et al., 2001), the replication dynamics of each chromosome can be modeled. Data is shown for chromosome 10 in the SSDDCS strain without (A) or with (B) galactose induction: leftward- and rightward-moving forks are colored blue and orange, respectively, with thickness proportional to probability. Replication forks diverge from origins (valleys) and progress at a constant rate until they converge at FMZs (peaks). The average replication time of each base pair is indicated by a green line. The earliest origin is set to t=0 in each case. Other chromosomes are shown in Fig. S7.
(C) Chromosome-wide comparison of our calculated average replication time and previously determined trep values (Raghuraman et al., 2001) for chromosome 10 in the uninduced SSDDCS strain.
(D) Column graph indicating the Pearson correlation between calculated timing profiles and previously determined trep values (Raghuraman et al., 2001) for wild-type (average of two datasets), and uninduced/induced (average of two datasets) SSDDCS strains. Reported correlation (RMSD) is for the entire chromosome calculated at 2.5kb intervals.

