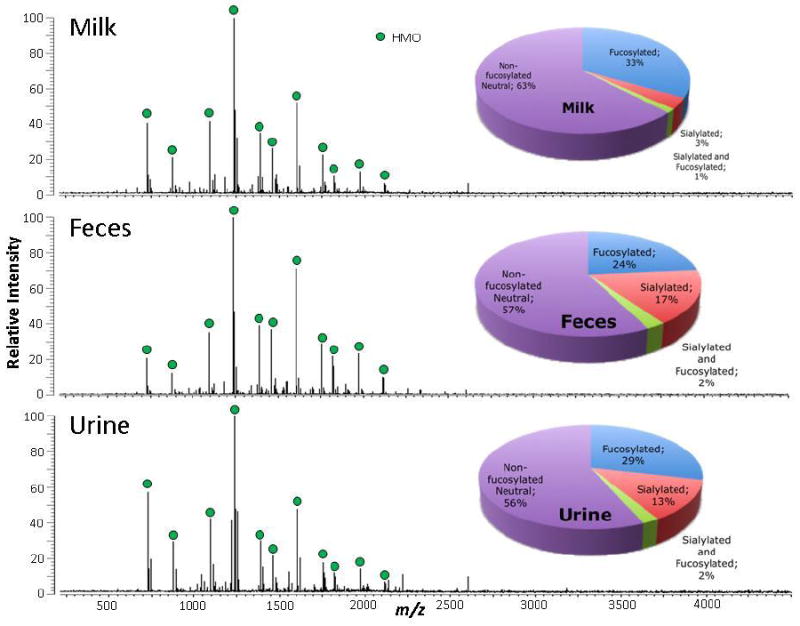
Figure 2.

MALDI FT-ICR MS profiles in positive ion mode of the HMOs in milk (A), feces (B), and urine (C) of a mother-preterm infant dyad. Milk, feces and urine samples are 5, 1 and 150 ug, respectively. HMOs are marked with blue dots. Distributions of fucosylated and sialylated glycans are based on HMO intensities normalized against the total HMO intensities. Pie charts represent nanoLC MS data.
