Figure 6.

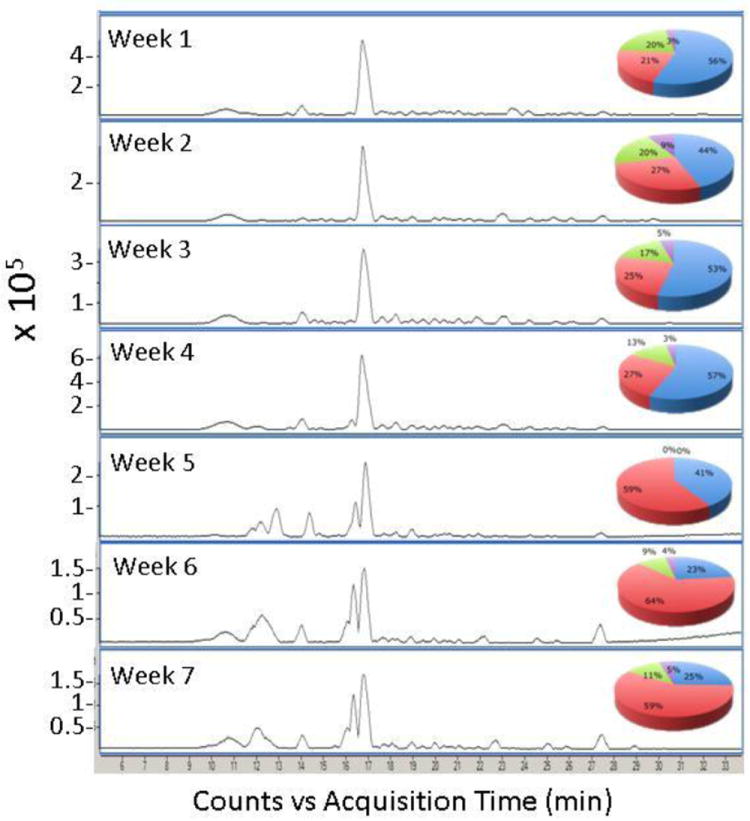
Temporal nano-LC Chip/TOF MS base peak chromatograms of the MS spectra shown in Figure 5. The pie charts show the distributions based on abundances normalized according to the total HMO abundance per sample using nano-LC Chip/TOF MS

Temporal nano-LC Chip/TOF MS base peak chromatograms of the MS spectra shown in Figure 5. The pie charts show the distributions based on abundances normalized according to the total HMO abundance per sample using nano-LC Chip/TOF MS