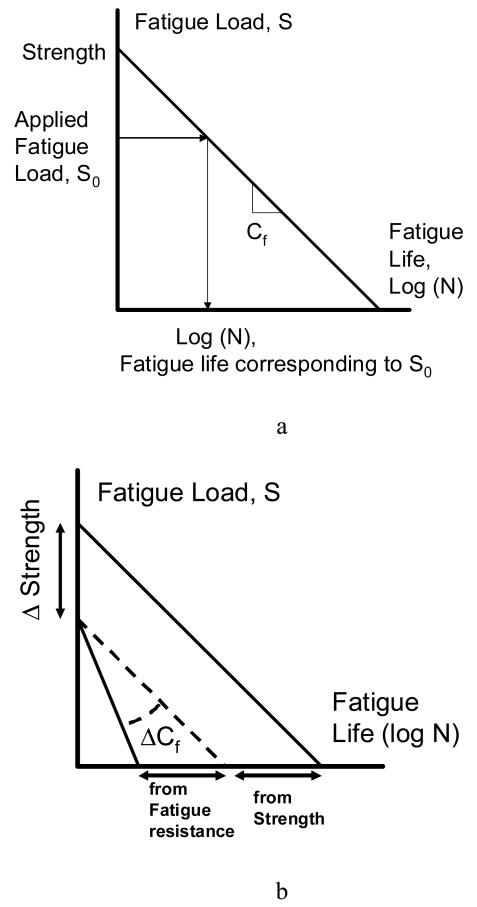
Figure 2.
a) Hypothetical S-N curve showing fatigue life in relationship with the applied loads. Note that the intercept represents the monotonic strength and the slope represents the fatigue compliance (or reciprocally, fatigue resistance) of the material (the smaller the absolute magnitude of the slope the less fatigue resistant the material is). In this experiment, fatigue life is scaled with the estimated strength of the vertebrae making the predicted fatigue life largely a function of fatigue resistance. b) Two hypothetical S-N curves (solid lines) showing strength (intercept) and fatigue resistance (slope) contributions to fatigue life. We hypothesize that density (BMD.Av) contributes to fatigue life by largely affecting strength whereas fatigue 2 resistance contribution to fatigue life is determined by tissue heterogeneity (BMD.SD).

