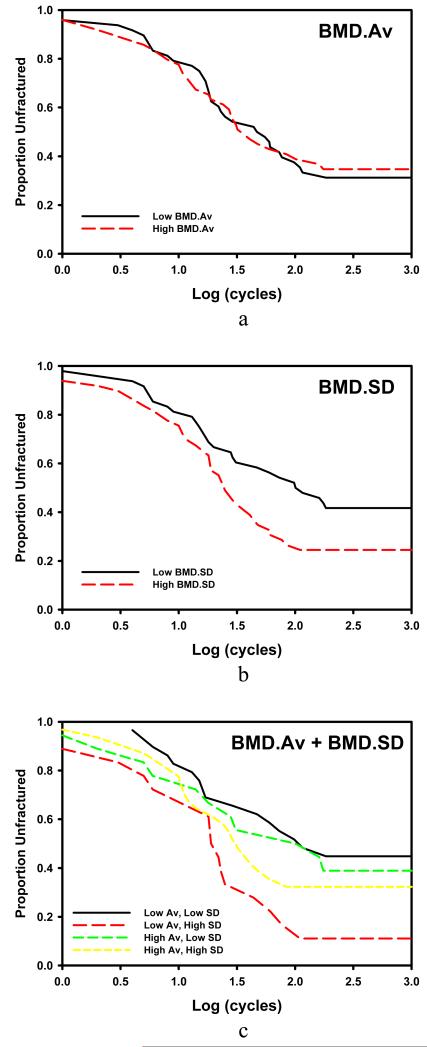
Figure 4.
Kaplan-Meier survival curves depicting the proportion of vertebra unfractured (y-axis) by the number of cycles (x-axis, log10). For the purpose of visualization, the bones are stratified as having high or low BMD.Av and BMD.SD in this study set relative to the median of those measures. Panel c shows that the bones with higher BMD.SD perform worse (red, large dash) though the effect is less in those with high BMD.Av (yellow small dash).

