
Figure 2.
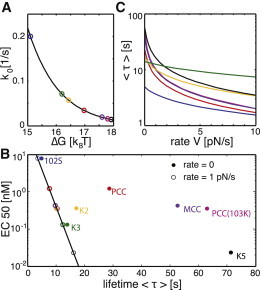
pMHC-TCR interactions accelerated by pulling. (A) Equation 3 was used to estimate the activation barrier, ΔG, from the published data for the off-rate of the seven peptides 102S (blue), PCC (red), MCC (violet), K2 (yellow), PCC(103K) (magenta), K3 (green), and K5 (black) (18). The black line shows Eq. 3, using D = 5 × 10⁻¹⁴ m2/s and xβ = 4 Å. (B) EC50 values of different peptides are plotted against the mean bond lifetime, , for a rate of V = 1 pN/s (open symbols) and V = 0 (solid symbols); ΔG was taken from A, and xβ was adjusted such that the log(EC50) values show a linear dependence on τ. (C) Mean bond lifetime, , is plotted against the applied pulling rate for seven different pMHCs (seeTable 1).