
Figure 2.
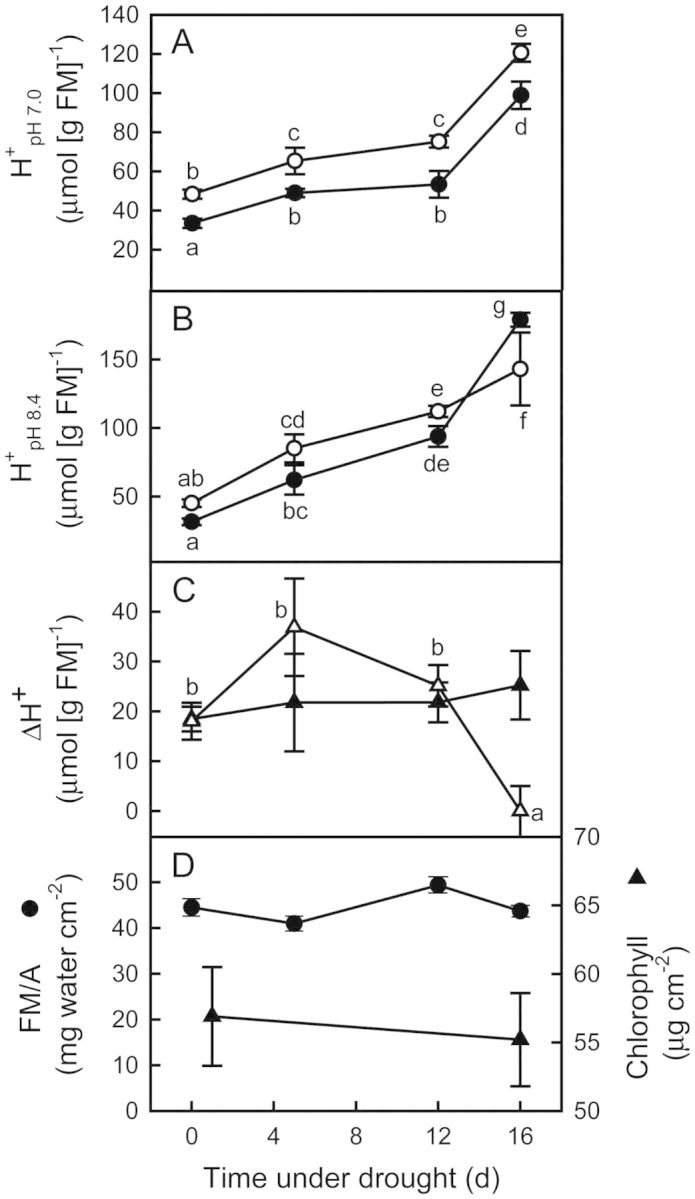
Time course of changes with drought in leaves of E. milii in (A) H+ content titrated to pH 7.0 (empty circles, dawn; filled circles, dusk); (B) H+ content titrated to pH 8.4 (empty circles, dawn; filled circles, dusk); (C) nocturnal H+ accumulation (empty triangles, pH 8.4; filled triangles, pH 7.0), and (D) dawn leaf FM per area (circles) and chlorophyll content (triangles). Values are mean ± SE (n = 12). Different letters indicate significant differences at P < 0.05 after a two-way ANOVA (time under drought × hour of day for each pH in A and B) and a one-way ANOVA (time under drought for each pH in C).