Figure 5.

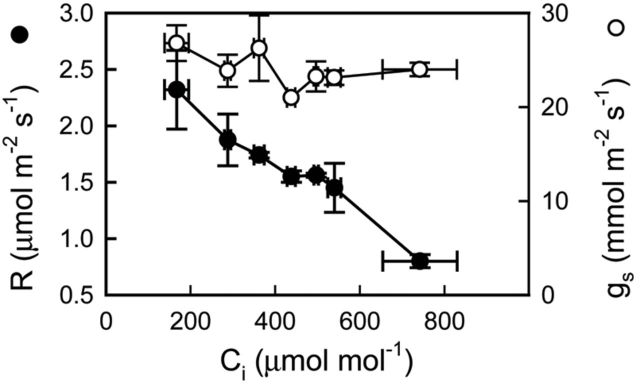
Response curves to leaf intercellular CO2 concentration of nocturnal respiration rate and stomatal conductance in watered plants of E. milii. Filled symbols, R; empty symbols, gs. Values are mean ± SE (n = 6).

Response curves to leaf intercellular CO2 concentration of nocturnal respiration rate and stomatal conductance in watered plants of E. milii. Filled symbols, R; empty symbols, gs. Values are mean ± SE (n = 6).