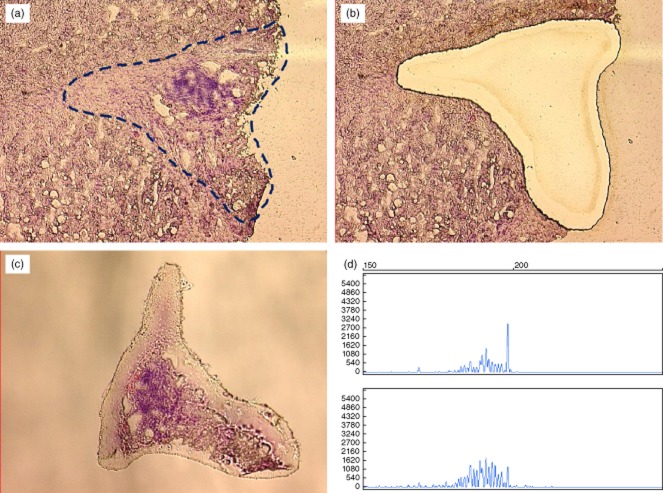
Fig. 2.
Example of laser capture microdissection (LCM)-based analysis: (a) section of liver biopsy showing enlarged portal tract with heavy inflammatory infiltrate and lymphoid aggregate, with appearance of a lymphoid follicle; (b) cleared area remaining in the context of tissue section after complete dissection of the portal structure; (c) dissected portal tract in the cap tube containing lysis buffer for molecular procedure; (d) analysis performed with genomic DNA obtained from microdissected portal tract in the upper square and on DNA obtained from entire liver sample in the lower square. Spectratyping profile shows an oligoclonal distribution in the former and plyclonal feature in the latter.

